Mono County, California
County in California, United States
County in California, United States

Seal
Logo

Interactive map of Mono County

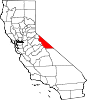
Location in the state of California
Supervisors
- Jennifer Kreitz
- Rhonda Duggan
- Bob Gardner
- John Peters
- Lynda Salcido
(2020)[6]
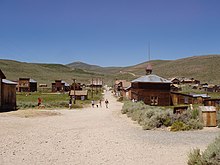
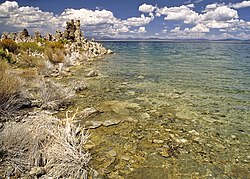
Mono County (/ˈmoʊnoʊ/ MOH-noh) is a county located in the east central portion of the U.S. state of California. As of the 2020 census, the population was 13,195,[6] making it the fourth-least populous county in California. The county seat is Bridgeport.[7][8] The county is located east of the Sierra Nevada between Yosemite National Park and Nevada. The only incorporated town in the county is Mammoth Lakes,[9] which is located at the foot of Mammoth Mountain.[10] Other locations, such as June Lake, are also famous as skiing and fishing resorts. Located in the middle of the county is Mono Lake, a vital habitat for millions of migratory and nesting birds. The lake is located in a wild natural setting, with pinnacles of tufa arising out of the salty and alkaline lake. Also located in Mono County is Bodie, the official state gold rush ghost town, which is now a California State Historic Park.
History
Mono County was formed in 1861 from parts of Calaveras, Fresno and Mariposa counties. A portion of northern Mono County contributed to the formation of Alpine County in 1864; parts of the county's territory were given to Inyo County in 1866.
The county is named after Mono Lake which, in 1852, was named for a Native American Paiute tribe, the Mono people, who historically inhabited the Sierra Nevada from north of Mono Lake to Owens Lake. The tribe's western neighbors, the Yokuts, called them monachie, meaning "fly people" because they used fly larvae as their chief food staple and trading article.[11]
Archeologists know almost nothing about the first inhabitants of the county, as little material evidence has been found from them. The Kuzedika, a band of Paiute, had been there many generations by the time the first anglophones arrived. The Kuzedika were hunter-gatherers and their language is a part of the Shoshone language.[11]
Geography
According to the U.S. Census Bureau, the county has a total area of 3,132 square miles (8,110 km2), of which 3,049 square miles (7,900 km2) is land and 83 square miles (210 km2) (2.6%) is water.[12] The highest point in Mono County is White Mountain Peak which, at 14,252 feet (4,344 m), is the third-highest peak in California.
Adjacent counties
- Inyo County - south
- Fresno County - southwest
- Madera County - southwest
- Tuolumne County- west
- Alpine County - northwest
- Douglas County, Nevada - north
- Lyon County, Nevada - northeast
- Mineral County, Nevada - east
- Esmeralda County, Nevada - southeast
National protected areas
- Inyo National Forest (part)
- Humboldt–Toiyabe National Forest (part)
- Granite Mountain Wilderness (California)[13]
Demographics
| Census | Pop. | Note | %± |
|---|---|---|---|
| 1870 | 430 | — | |
| 1880 | 7,499 | 1,644.0% | |
| 1890 | 2,002 | −73.3% | |
| 1900 | 2,167 | 8.2% | |
| 1910 | 2,042 | −5.8% | |
| 1920 | 960 | −53.0% | |
| 1930 | 1,360 | 41.7% | |
| 1940 | 2,299 | 69.0% | |
| 1950 | 2,115 | −8.0% | |
| 1960 | 2,213 | 4.6% | |
| 1970 | 4,016 | 81.5% | |
| 1980 | 8,577 | 113.6% | |
| 1990 | 9,956 | 16.1% | |
| 2000 | 12,853 | 29.1% | |
| 2010 | 14,202 | 10.5% | |
| 2020 | 13,195 | −7.1% | |
| 2023 (est.) | 13,066 | [14] | −1.0% |
| U.S. Decennial Census[15] 1790–1960[16] 1900–1990[17] 1990–2000[18] 2010[19] 2020[20] | |||
2021
In June 2021, U.S. News & World Report ranked the county with the third best life expectancy in the United States at 96.5 years old.[21]
2020 census
| Race / Ethnicity | Pop 2010[19] | Pop 2020[20] | % 2010 | % 2020 |
|---|---|---|---|---|
| White alone (NH) | 9,687 | 8,679 | 68.21% | 65.77% |
| Black or African American alone (NH) | 42 | 68 | 0.30% | 0.52% |
| Native American or Alaska Native alone (NH) | 239 | 177 | 1.68% | 1.34% |
| Asian alone (NH) | 191 | 159 | 1.34% | 1.21% |
| Pacific Islander alone (NH) | 11 | 26 | 0.08% | 0.20% |
| Some Other Race alone (NH) | 33 | 78 | 0.23% | 0.59% |
| Mixed Race/Multi-Racial (NH) | 237 | 501 | 1.67% | 3.80% |
| Hispanic or Latino (any race) | 3,762 | 3,507 | 26.49% | 26.58% |
| Total | 14,202 | 13,195 | 100.00% | 100.00% |
Note: the US Census treats Hispanic/Latino as an ethnic category. This table excludes Latinos from the racial categories and assigns them to a separate category. Hispanics/Latinos can be of any race.
2011
| Population, race, and income | |||||
|---|---|---|---|---|---|
| Total population[22] | 14,016 | ||||
| White[22] | 11,313 | 80.7% | |||
| Black or African American[22] | 180 | 1.3% | |||
| American Indian or Alaska Native[22] | 633 | 4.5% | |||
| Asian[22] | 78 | 0.6% | |||
| Native Hawaiian or other Pacific Islander[22] | 47 | 0.3% | |||
| Some other race[22] | 1,459 | 10.4% | |||
| Two or more races[22] | 306 | 2.2% | |||
| Hispanic or Latino (of any race)[23] | 3,613 | 25.8% | |||
| Per capita income[24] | $28,789 | ||||
| Median household income[25] | $60,469 | ||||
| Median family income[26] | $78,079 | ||||
Places by population, race, and income
| Place | Type[27] | Population[22] | White[22] | Other[22] [note 1] | Asian[22] | Black or African American[22] | Native American[22] [note 2] | Hispanic or Latino (of any race)[23] |
|---|---|---|---|---|---|---|---|---|
| Aspen Springs | CDP | 0 | 0.0% | 0.0% | 0.0% | 0.0% | 0.0% | 0.0% |
| Benton | CDP | 76 | 67.1% | 0.0% | 0.0% | 0.0% | 32.9% | 27.6% |
| Bridgeport | CDP | 456 | 82.7% | 1.8% | 0.0% | 2.6% | 12.9% | 5.3% |
| Chalfant | CDP | 749 | 100.0% | 0.0% | 0.0% | 0.0% | 0.0% | 1.3% |
| Coleville | CDP | 652 | 89.0% | 7.7% | 0.0% | 3.4% | 0.0% | 38.3% |
| Crowley Lake | CDP | 496 | 100.0% | 0.0% | 0.0% | 0.0% | 0.0% | 8.9% |
| June Lake | CDP | 406 | 100.0% | 0.0% | 0.0% | 0.0% | 0.0% | 0.0% |
| Lee Vining | CDP | 406 | 32.8% | 13.1% | 0.0% | 0.0% | 54.2% | 50.7% |
| McGee Creek | CDP | 107 | 100.0% | 0.0% | 0.0% | 0.0% | 0.0% | 0.0% |
| Mammoth Lakes | Town | 8,081 | 75.4% | 18.6% | 0.8% | 1.8% | 3.3% | 35.7% |
| Mono City | CDP | 126 | 89.7% | 10.3% | 0.0% | 0.0% | 0.0% | 0.0% |
| Paradise | CDP | 383 | 94.5% | 4.4% | 1.0% | 0.0% | 0.0% | 12.0% |
| Sunny Slopes | CDP | 149 | 100.0% | 0.0% | 0.0% | 0.0% | 0.0% | 0.0% |
| Swall Meadows | CDP | 461 | 100.0% | 0.0% | 0.0% | 0.0% | 0.0% | 0.0% |
| Topaz | CDP | 75 | 100.0% | 0.0% | 0.0% | 0.0% | 0.0% | 0.0% |
| Walker | CDP | 750 | 79.6% | 13.2% | 0.0% | 0.0% | 7.2% | 10.7% |
| ‡ Data for Mono County area of this CDP | ||||||||
| Place | Type[27] | Population[28] | Per capita income[24] | Median household income[25] | Median family income[26] |
|---|---|---|---|---|---|
| Aspen Springs | CDP | 0 | [29] | [29] | [29] |
| Benton | CDP | 76 | $12,570 | $7,414 | [29] |
| Bridgeport | CDP | 456 | $21,597 | $68,750 | $78,500 |
| Chalfant | CDP | 749 | $36,325 | $64,018 | $108,219 |
| Coleville | CDP | 652 | $17,365 | $56,591 | $43,250 |
| Crowley Lake | CDP | 496 | $41,610 | $85,299 | $96,500 |
| June Lake | CDP | 406 | $22,958 | $25,570 | [29] |
| Lee Vining | CDP | 406 | $18,698 | $70,840 | $71,152 |
| McGee Creek | CDP | 107 | $34,573 | $85,990 | $85,990 |
| Mammoth Lakes | Town | 8,081 | $27,832 | $56,521 | $72,469 |
| Mono City | CDP | 126 | $26,037 | $49,020 | $49,020 |
| Paradise | CDP | 383 | $33,544 | $81,736 | $105,227 |
| Sunny Slopes | CDP | 149 | $61,994 | $128,310 | $128,310 |
| Swall Meadows | CDP | 461 | $53,616 | $93,983 | $94,331 |
| Topaz | CDP | 75 | [29] | [29] | [29] |
| Walker | CDP | 750 | $23,381 | $49,097 | $54,028 |
2010 Census
The 2010 United States Census reported that Mono County had a population of 14,202. The racial makeup of Mono County was 11,697 (82.4%) White, 47 (0.3%) African American, 302 (2.1%) Native American, 192 (1.4%) Asian, 11 (0.1%) Pacific Islander, 1,539 (10.8%) from other races, and 414 (2.9%) from two or more races. Hispanic or Latino of any race were 3,762 persons (26.5%).[30]
| Population reported at 2010 United States Census | |||||||||
|---|---|---|---|---|---|---|---|---|---|
The County | Total Population | White | African American | Native American | Asian | Pacific Islander | other races | two or more races | Hispanic or Latino (of any race) |
| Mono County | 14,202 | 11,697 | 47 | 302 | 192 | 11 | 1,539 | 414 | 3,762 |
Incorporated town | Total Population | White | African American | Native American | Asian | Pacific Islander | other races | two or more races | Hispanic or Latino (of any race) |
| Mammoth Lakes | 8,234 | 6,643 | 29 | 49 | 128 | 5 | 1,151 | 229 | 2,772 |
Census-designated place | Total Population | White | African American | Native American | Asian | Pacific Islander | other races | two or more races | Hispanic or Latino (of any race) |
| Aspen Springs | 65 | 62 | 0 | 0 | 2 | 0 | 0 | 1 | 1 |
| Benton | 280 | 199 | 1 | 59 | 1 | 0 | 15 | 5 | 38 |
| Bridgeport | 575 | 484 | 1 | 43 | 1 | 0 | 25 | 21 | 148 |
| Chalfant | 651 | 594 | 0 | 13 | 5 | 0 | 16 | 23 | 67 |
| Coleville | 495 | 386 | 6 | 10 | 8 | 0 | 62 | 23 | 110 |
| Crowley Lake | 875 | 769 | 4 | 6 | 11 | 0 | 60 | 25 | 128 |
| June Lake | 629 | 534 | 0 | 7 | 2 | 0 | 78 | 8 | 137 |
| Lee Vining | 222 | 126 | 0 | 25 | 0 | 0 | 64 | 7 | 96 |
| McGee Creek | 41 | 39 | 0 | 0 | 0 | 0 | 0 | 2 | 2 |
| Mono City | 172 | 156 | 0 | 1 | 2 | 0 | 2 | 11 | 37 |
| Paradise | 153 | 130 | 0 | 2 | 6 | 0 | 5 | 10 | 14 |
| Sunny Slopes | 182 | 159 | 0 | 2 | 7 | 4 | 0 | 10 | 3 |
| Swall Meadows | 220 | 201 | 0 | 3 | 5 | 0 | 2 | 9 | 6 |
| Topaz | 50 | 44 | 0 | 1 | 0 | 0 | 5 | 0 | 24 |
| Walker | 721 | 629 | 3 | 57 | 3 | 1 | 13 | 15 | 70 |
Other unincorporated areas | Total Population | White | African American | Native American | Asian | Pacific Islander | other races | two or more races | Hispanic or Latino (of any race) |
| All others not CDPs (combined) | 637 | 542 | 3 | 24 | 11 | 1 | 41 | 15 | 109 |
2000
As of the census[31] of 2000, there were 12,853 people, 5,137 households, and 3,143 families residing in the county. The population density was 4/sq mi (1.5/km2). There were 11,757 housing units at an average density of 4/sq mi (1.5/km2). The racial makeup of the county was 84.2% White, 0.5% Black or African American, 2.4% Native American, 1.1% Asian, 0.1% Pacific Islander, 9.5% from other races, and 2.3% from two or more races. 17.7% of the population were Hispanic or Latino of any race. 13.4% were of German, 12.6% Irish and 11.4% English ancestry according to Census 2000. 84.0% spoke English and 15.1% Spanish as their first language.
There were 5,137 households, out of which 28.7% had children under the age of 18 living with them, 50.6% were married couples living together, 6.5% had a female householder with no husband present, and 38.8% were non-families. 26.6% of all households were made up of individuals, and 4.3% had someone living alone who was 65 years of age or older. The average household size was 2.43 and the average family size was 2.98.
In the county, the population was spread out, with 23.0% under the age of 18, 10.3% from 18 to 24, 33.4% from 25 to 44, 25.6% from 45 to 64, and 7.6% who were 65 years of age or older. The median age was 36 years. For every 100 females there were 121.8 males. For every 100 females age 18 and over, there were 126.8 males.
The median income for a household in the county was $44,992, and the median income for a family was $50,487. Males had a median income of $32,600 versus $26,227 for females. The per capita income for the county was $23,422. About 6.3% of families and 11.5% of the population were below the poverty line, including 12.2% of those under age 18 and 1.9% of those age 65 or over.
Politics
Voter registration
| Population and registered voters | ||
|---|---|---|
| Total population[22] | 14,016 | |
| Registered voters[32][note 3] | 6,000 | 42.8% |
| Democratic[32] | 1,970 | 32.8% |
| Republican[32] | 2,167 | 36.1% |
| Democratic–Republican spread[32] | -197 | -3.3% |
| Independent[32] | 248 | 4.1% |
| Green[32] | 62 | 1.0% |
| Libertarian[32] | 43 | 0.7% |
| Peace and Freedom[32] | 17 | 0.3% |
| Americans Elect[32] | 0 | 0.0% |
| Other[32] | 5 | 0.1% |
| No party preference[32] | 1,488 | 24.8% |
Cities by population and voter registration
| City | Population[22] | Registered voters[32] [note 3] | Democratic[32] | Republican[32] | D–R spread[32] | Other[32] | No party preference[32] |
|---|---|---|---|---|---|---|---|
| Mammoth Lakes | 8,081 | 36.5% | 35.0% | 29.3% | +5.7% | 10.3% | 29.1% |
| North Mono County | 2,803 | 46.7% | 28.5% | 45.7% | -17.2% | 5.3% | 20.3% |
| South Mono County excluding Mammoth Lakes | 3,130 | 55.6% | 32.3% | 40.5% | -8.2% | 5.7% | 20.8% |
Overview
In November 2008, Mono County was one of just three counties in California's interior in which voters rejected Proposition 8 which sought to ban gay marriage. The county's voters rejected Proposition 8 by 55.5 percent to 44.5 percent. The other interior counties in which Proposition 8 failed to receive a majority of votes were neighboring Alpine County and Yolo County.[33]
Mono County is in California's 3rd congressional district, represented by Republican Kevin Kiley.[34]
In the state legislature Mono is in the 5th Assembly district, which is held by Republican Joe Patterson, and the 4th Senate district, which is held by Democrat Marie Alvarado-Gil.
| Year | Republican | Democratic | Third party | |||
|---|---|---|---|---|---|---|
| No. | % | No. | % | No. | % | |
| 2020 | 2,513 | 37.30% | 4,013 | 59.56% | 212 | 3.15% |
| 2016 | 2,111 | 39.97% | 2,773 | 52.51% | 397 | 7.52% |
| 2012 | 2,285 | 44.10% | 2,733 | 52.75% | 163 | 3.15% |
| 2008 | 2,354 | 42.25% | 3,093 | 55.52% | 124 | 2.23% |
| 2004 | 2,621 | 49.10% | 2,628 | 49.23% | 89 | 1.67% |
| 2000 | 2,296 | 52.53% | 1,788 | 40.91% | 287 | 6.57% |
| 1996 | 1,882 | 46.00% | 1,580 | 38.62% | 629 | 15.38% |
| 1992 | 1,570 | 36.05% | 1,489 | 34.19% | 1,296 | 29.76% |
| 1988 | 2,177 | 61.38% | 1,284 | 36.20% | 86 | 2.42% |
| 1984 | 2,659 | 72.31% | 962 | 26.16% | 56 | 1.52% |
| 1980 | 2,132 | 62.32% | 865 | 25.29% | 424 | 12.39% |
| 1976 | 1,600 | 58.80% | 1,025 | 37.67% | 96 | 3.53% |
| 1972 | 1,872 | 66.88% | 828 | 29.58% | 99 | 3.54% |
| 1968 | 1,130 | 64.28% | 465 | 26.45% | 163 | 9.27% |
| 1964 | 850 | 56.07% | 666 | 43.93% | 0 | 0.00% |
| 1960 | 912 | 66.33% | 457 | 33.24% | 6 | 0.44% |
| 1956 | 673 | 73.79% | 237 | 25.99% | 2 | 0.22% |
| 1952 | 891 | 76.61% | 264 | 22.70% | 8 | 0.69% |
| 1948 | 541 | 64.79% | 255 | 30.54% | 39 | 4.67% |
| 1944 | 378 | 60.87% | 242 | 38.97% | 1 | 0.16% |
| 1940 | 459 | 46.13% | 523 | 52.56% | 13 | 1.31% |
| 1936 | 241 | 34.09% | 458 | 64.78% | 8 | 1.13% |
| 1932 | 199 | 34.25% | 374 | 64.37% | 8 | 1.38% |
| 1928 | 220 | 61.80% | 127 | 35.67% | 9 | 2.53% |
| 1924 | 166 | 53.55% | 45 | 14.52% | 99 | 31.94% |
| 1920 | 170 | 67.73% | 56 | 22.31% | 25 | 9.96% |
| 1916 | 137 | 42.02% | 158 | 48.47% | 31 | 9.51% |
| 1912 | 3 | 0.81% | 182 | 49.32% | 184 | 49.86% |
| 1908 | 224 | 59.89% | 121 | 32.35% | 29 | 7.75% |
| 1904 | 245 | 64.64% | 82 | 21.64% | 52 | 13.72% |
| 1900 | 284 | 52.11% | 258 | 47.34% | 3 | 0.55% |
| 1896 | 259 | 44.27% | 315 | 53.85% | 11 | 1.88% |
| 1892 | 286 | 53.36% | 166 | 30.97% | 84 | 15.67% |
Crime
The following table includes the number of incidents reported and the rate per 1,000 persons for each type of offense.
| Population and crime rates | ||
|---|---|---|
| Population[22] | 14,016 | |
| Violent crime[36] | 49 | 3.50 |
| Homicide[36] | 0 | 0.00 |
| Forcible rape[36] | 3 | 0.21 |
| Robbery[36] | 2 | 0.14 |
| Aggravated assault[36] | 44 | 3.14 |
| Property crime[36] | 253 | 18.05 |
| Burglary[36] | 120 | 8.56 |
| Larceny-theft[36][note 4] | 275 | 19.62 |
| Motor vehicle theft[36] | 13 | 0.93 |
| Arson[36] | 1 | 0.07 |
Cities by population and crime rates
| City | Population[37] | Violent crimes[37] | Violent crime rate per 1,000 persons | Property crimes[37] | Property crime rate per 1,000 persons |
|---|---|---|---|---|---|
| Mammoth Lakes | 8,373 | 38 | 4.54 | 196 | 23.41 |
Transportation

Major highways
 U.S. Route 6
 U.S. Route 395
 State Route 89
 State Route 108
 State Route 120
 State Route 158
 State Route 167
 State Route 168
 State Route 182
 State Route 203
 State Route 266
 State Route 270


Public transportation
Eastern Sierra Transit Authority operates intercity bus service along U.S. 395, as well as local services in Mammoth Lakes. Service extends south to Lancaster, California (Los Angeles County) and north to Reno, Nevada.
Yosemite Area Regional Transit System (YARTS) also runs along U.S. 395 from Mammoth Lakes to Lee Vining before entering Yosemite National Park.
Airports
General aviation airports in Mono County include Bryant Field near Bridgeport, Mammoth Yosemite Airport and Lee Vining Airport. In December 2021, seasonal commercial air service by United Airlines to San Francisco, Los Angeles, and Denver began at the Eastern Sierra Regional Airport in Bishop, providing local service to southern Mono County.
Communities
Town
Census-designated places
Population ranking
The population ranking of the following table is based on the 2010 census of Mono County.[38]
† county seat
| Rank | City/Town/etc. | Municipal type | Population (2010 Census) |
|---|---|---|---|
| 1 | Mammoth Lakes | Town | 8,234 |
| 2 | Crowley Lake | CDP | 875 |
| 3 | Walker | CDP | 721 |
| 4 | Chalfant | CDP | 651 |
| 5 | June Lake | CDP | 629 |
| 6 | † Bridgeport | CDP | 575 |
| 7 | Coleville | CDP | 495 |
| 8 | Benton | CDP | 280 |
| 9 | Lee Vining | CDP | 222 |
| 10 | Swall Meadows | CDP | 220 |
| 11 | Sunny Slopes | CDP | 182 |
| 12 | Mono City | CDP | 172 |
| 13 | Paradise | CDP | 153 |
| 14 | Benton Reservation (Utu Utu Gwaitu Paiute Tribe)[39] | AIAN | 76 |
| 15 | Aspen Springs | CDP | 65 |
| 16 | Topaz | CDP | 50 |
| 17 | McGee Creek | CDP | 41 |
| 18 | Bridgeport Reservation (Paiute Indians)[40] | AIAN | 35 |
See also
- List of school districts in Mono County, California
- National Register of Historic Places listings in Mono County, California
Notes
- ^ Other = Some other race + Two or more races
- ^ Native American = Native Hawaiian or other Pacific Islander + American Indian or Alaska Native
- ^ a b Percentage of registered voters with respect to total population. Percentages of party members with respect to registered voters follow.
- ^ Only larceny-theft cases involving property over $400 in value are reported as property crimes.
References
- ^ "District 2: Rhonda Duggan, Chair (2023) | Mono County California".
- ^ "District 4: John Peters, Vice Chair (2023) | Mono County California".
- ^ "District 1: Jennifer Kreitz, Chair Pro-Tem (2023) | Mono County California".
- ^ "Board of Supervisors | Mono County California".
- ^ "White Mountain". Peakbagger.com. Retrieved April 11, 2015.
- ^ a b "Mono County, California". United States Census Bureau. Retrieved January 30, 2022.
- ^ "Mono County General Information". Archived from the original on December 22, 2007. Retrieved November 5, 2007.
- ^ "Find a County". National Association of Counties. Retrieved June 7, 2011.
- ^ "Town of Mammoth Lakes, California". Retrieved November 5, 2007.
- ^ "Mammoth Mountain". Retrieved November 5, 2007.
- ^ a b Sprague, Marguerite (2003). "Welcome to Bodie". Bodie's Gold. Reno, Nevada: University of Nevada Press. pp. 3, 205. ISBN 0-87417-628-X.
- ^ "2010 Census Gazetteer Files". United States Census Bureau. August 22, 2012. Retrieved September 28, 2015.
- ^ Granite Mountain Wilderness Archived August 28, 2016, at the Wayback Machine
- ^ "Annual Estimates of the Resident Population for Counties: April 1, 2020 to July 1, 2023". United States Census Bureau. Retrieved March 26, 2024.
- ^ "Census of Population and Housing from 1790-2000". US Census Bureau. Retrieved January 24, 2022.
- ^ "Historical Census Browser". University of Virginia Library. Retrieved September 28, 2015.
- ^ Forstall, Richard L., ed. (March 27, 1995). "Population of Counties by Decennial Census: 1900 to 1990". United States Census Bureau. Retrieved September 28, 2015.
- ^ "Census 2000 PHC-T-4. Ranking Tables for Counties: 1990 and 2000" (PDF). United States Census Bureau. April 2, 2001. Retrieved September 28, 2015.
- ^ a b "P2 HISPANIC OR LATINO, AND NOT HISPANIC OR LATINO BY RACE - 2010: DEC Redistricting Data (PL 94-171) - Mono County, California". United States Census Bureau.
- ^ a b "P2 HISPANIC OR LATINO, AND NOT HISPANIC OR LATINO BY RACE - 2020: DEC Redistricting Data (PL 94-171) - Mono County, California". United States Census Bureau.
- ^ Cirruzzo, Chelsea (June 30, 2021). "The 25 Counties With the Longest Life Expectancy". U.S. News & World Report. Retrieved July 1, 2021.
- ^ a b c d e f g h i j k l m n o p q U.S. Census Bureau. American Community Survey, 2011 American Community Survey 5-Year Estimates, Table B02001. U.S. Census website. Retrieved October 26, 2013.
- ^ a b U.S. Census Bureau. American Community Survey, 2011 American Community Survey 5-Year Estimates, Table B03003. U.S. Census website. Retrieved October 26, 2013.
- ^ a b U.S. Census Bureau. American Community Survey, 2011 American Community Survey 5-Year Estimates, Table B19301. U.S. Census website. Retrieved October 21, 2013.
- ^ a b U.S. Census Bureau. American Community Survey, 2011 American Community Survey 5-Year Estimates, Table B19013. U.S. Census website. Retrieved October 21, 2013.
- ^ a b U.S. Census Bureau. American Community Survey, 2011 American Community Survey 5-Year Estimates, Table B19113. U.S. Census website. Retrieved October 21, 2013.
- ^ a b U.S. Census Bureau. American Community Survey, 2011 American Community Survey 5-Year Estimates. U.S. Census website. Retrieved October 21, 2013.
- ^ U.S. Census Bureau. American Community Survey, 2011 American Community Survey 5-Year Estimates, Table B01003. U.S. Census website. Retrieved October 21, 2013.
- ^ a b c d e f g h Data unavailable
- ^ "2010 Census P.L. 94-171 Summary File Data". United States Census Bureau.
- ^ "U.S. Census website". United States Census Bureau. Retrieved May 14, 2011.
- ^ a b c d e f g h i j k l m n o p q California Secretary of State. February 10, 2013 - Report of Registration Archived July 27, 2013, at the Wayback Machine. Retrieved October 31, 2013.
- ^ "California results". Los Angeles Times. September 16, 2014.
- ^ "California's 8th Congressional District - Representatives & District Map". Civic Impulse, LLC. Retrieved July 11, 2023.
- ^ Leip, David. "Dave Leip's Atlas of U.S. Presidential Elections". uselectionatlas.org. Retrieved September 1, 2018.
- ^ a b c d e f g h i j Office of the Attorney General, Department of Justice, State of California. Table 11: Crimes – 2009 Archived December 2, 2013, at the Wayback Machine. Retrieved November 14, 2013.
- ^ a b c United States Department of Justice, Federal Bureau of Investigation. Crime in the United States, 2012, Table 8 (California). Retrieved November 14, 2013.
- ^ CNMP, US Census Bureau. "This site has been redesigned and relocated. - U.S. Census Bureau". www.census.gov.
- ^ "2010 Census Interactive Population Search". Archived from the original on February 6, 2017. Retrieved December 13, 2018.
- ^ "2010 Census Interactive Population Search". Archived from the original on February 6, 2017. Retrieved December 13, 2018.
Further reading
- Rockwell, G. L.; Honeywell, P. D. (2004). Water-quality data for selected stream sites in Bridgeport Valley, Mono County, California, April 2000 to June 2003. U.S. Geological Survey Data Series. Vol. 89. Reston, VA: U.S. Department of the Interior, U.S. Geological Survey.
External links
- Official website
- Mono County Film and Tourism Commission
Mono County, California at Wikipedia's sister projects:
 Media from Commons
 Travel guides from Wikivoyage
Places adjacent to Mono County, California | |
|---|---|


- v
- t
- e
Municipalities and communities of Mono County, California, United States
County seat: Bridgeport
- California portal
- United States portal

Authority control databases | |
|---|---|
| International |
|
| National |
|
| Other |
|


