Siskiyou County, California
County in California, United States
County in California, United States

Flag

Seal
"Mountains of Opportunity"

Interactive map of Siskiyou County
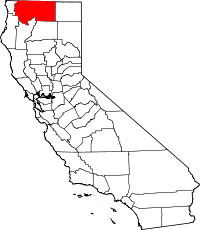
Location in the state of California
Supervisors
- Brandon Criss
- Ed Valenzuela
- Michael N. Kobseff
- Nancy Ogren
- Ray A. Haupt
(April 1, 2020)[3]
Siskiyou County (/ˈsɪskjuː/ ⓘ SISK-yoo) is a county located in the northwestern part of the U.S. state of California. As of the 2020 census, the population was 44,076.[3] Its county seat is Yreka and its highest point is Mount Shasta.[4] It falls within the Cascadia bioregion.[5]
Siskiyou County is in the Shasta Cascade region along the Oregon border. Because of its outdoor recreation, Mt. Shasta, McCloud River, and Gold Rush era history, it is an important tourist destination within the state.[citation needed]
History
Siskiyou County was created on March 22, 1852, from parts of Shasta and Klamath Counties, and named after the Siskiyou mountain range. Parts of the county's territory were given to Modoc County in 1855.
The county is the site of the central section of the Siskiyou Trail, which ran between California's Central Valley and the Pacific Northwest. The Siskiyou Trail followed indigenous footpaths, and was extended by Hudson's Bay Company trappers in the 1830s. Its length was increased by "Forty-Niners" during the California Gold Rush.
After the discovery of an important gold strike near today's Yreka, California, in 1851, prospectors flooded the area. This was described in detail by Joaquin Miller in his semi-autobiographical novel Life Amongst the Modocs.
In the mid-1880s, the construction of the Central Pacific Railroad along the Siskiyou Trail brought the first wave of tourism. Visitors were drawn by the county's many summer resorts, and to hunt or fish in the largely untouched region. The Southern Pacific railroad, the successor to the Central Pacific, called its rail line “The Road of A Thousand Wonders.”
In the early 1940s, Siskiyou County was home to the semi-serious State of Jefferson movement, which sought to create a new state from several counties of northern California and the adjoining counties of southern Oregon. The movement has seen a revival in recent years.
The origin of the word Siskiyou is not known. It may be a Chinook Jargon word for a "bob-tailed horse" (ultimately originating in Cree),[6] or as was argued before the State Senate in 1852, from the French Six Cailloux (six stones), a name given to a ford on the Umpqua River by Michel Laframboise and his Hudson's Bay Company trappers in 1832. Others claim the Six Cailloux name was appropriated by Stephen Meek, another Hudson's Bay Company trapper who discovered Scott Valley, for a crossing on the Klamath River near Hornbrook.
The county is home to the Black Bear Ranch, a commune started in 1968 with the slogan "Free Land for free people."
On September 4, 2013, the Siskiyou County Board of Supervisors voted 4 to 1 to secede from the State of California.[7]
Geography

According to the U.S. Census Bureau, the county has a total area of 6,347 square miles (16,440 km2), of which 6,278 square miles (16,260 km2) is land and 69 square miles (180 km2) (1.1%) is water.[8] It is the fifth-largest county by area in California.[citation needed]
Siskiyou County is geographically diverse. From towering Mount Shasta (elev. 14,179 ft (4,322 m)) near the center of the county, to lakes and dense forests, as well as desert, chaparral, and memorable waterfalls, the county is home to world-famous trout-fishing rivers and streams, such as the Sacramento and McCloud rivers. The county is dotted as well with lakes and reservoirs,[9] such as Castle Lake and Lake Siskiyou. Mount Shasta itself has a winter sports center. Pastoral Scott Valley in the western part of the county has many wide, tree-lined meadows, supporting large cattle ranches. The basins of northeastern Siskiyou County, including Butte Valley, Lower Klamath and Tule Lake basins, have some of the deepest and richest soils in the state, producing alfalfa, potatoes, horseradish, and brewing barley. Butte Valley nurseries are the leading source of premium strawberry plants in North America. Much of the county is densely forested with pine, fir, incense-cedar, oak, and madrone; Siskiyou County is also home to the rare Baker's Cypress Tree, Cupressus bakeri, which grows in only eleven scattered locations in the world, five of which are in Siskiyou County. The county's natural resources are most often used these days for skiing, snowboarding, hiking, mountain biking, camping, and wilderness recreation, as historic logging practices have been largely discontinued due to Federal and State environmental regulations. The county's water is viewed as sufficiently pure and abundant that the county is a source of significant amounts of bottled water, distributed throughout the country. A large Crystal Geyser plant is at the base of Mt. Shasta, near Weed.
Flora and fauna
Substantial amounts of the county are forested within the Siskiyou and Cascade Ranges, including significant oak woodland and mixed conifer forests. Siskiyou County is the northern extent of the range for California Buckeye,[10] a widespread California endemic. The Klamath National Forest occupies 1,700,000 acres (6,900 km2) of land which includes elements in Siskiyou County as well as Jackson County, Oregon.[11]
Adjacent counties
- Josephine County, Oregon - northwest
- Jackson County, Oregon - north
- Klamath County, Oregon - northeast
- Modoc County - east
- Shasta County - southeast
- Trinity County - south
- Humboldt County - southwest
- Del Norte County - west
National protected areas

- Butte Valley National Grassland
- Klamath National Forest (part)
- Lava Beds National Monument (part)
- Lower Klamath National Wildlife Refuge (part)
- Modoc National Forest (part)
- Rogue River National Forest (part)
- Shasta National Forest (part)
- Six Rivers National Forest (part)
- Tule Lake National Wildlife Refuge (part)
- Tule Lake Unit, World War II Valor in the Pacific National Monument (part)
Transportation

Major highways


Public transportation
Siskiyou Transit And General Express (STAGE)[12] operates buses connecting the more populated areas of the county. Amtrak trains stop in Dunsmuir. Amtrak Thruway formerly operated between Sacramento and Medford, OR, with stops in Yreka, Weed, Mount Shasta, and Dunsmuir, for passengers connecting to and from Amtrak trains in Sacramento or Stockton; this service was discontinued in 2009. Greyhound buses pass through the county on Interstate 5 with a stop in Weed.
Airports
Siskiyou County owns and operates Butte Valley Airport, Happy Camp Airport, Scott Valley Airport, Siskiyou County Airport and Weed Airport (all general aviation). Dunsmuir Municipal-Mott Airport and Montague-Yreka Rohrer Field are also within the county.
The closest airports for commercial domestic plane departures are Rogue Valley International-Medford Airport north of the county in Medford, Oregon, Crater Lake–Klamath Regional Airport, northeast of the county in Klamath Falls, Oregon, and Redding Municipal Airport south of the county in Redding, California.
Politics
Voter registration statistics
| Population and registered voters | ||
|---|---|---|
| Total population[13] | 44,687 | |
| Registered voters[14][note 1] | 25,582 | 57.2% |
| Democratic[14] | 8,253 | 32.3% |
| Republican[14] | 10,458 | 40.9% |
| Democratic–Republican spread[14] | -2,205 | -8.6% |
| Independent[14] | 1,126 | 4.4% |
| Green[14] | 196 | 0.8% |
| Libertarian[14] | 264 | 1.0% |
| Peace and Freedom[14] | 89 | 0.3% |
| Americans Elect[14] | 1 | 0.0% |
| Other[14] | 57 | 0.2% |
| No party preference[14] | 5,138 | 20.1% |
Cities by population and voter registration
| Cities by population and voter registration | |||||||
|---|---|---|---|---|---|---|---|
| City | Population[13] | Registered voters[14] [note 1] | Democratic[14] | Republican[14] | D–R spread[14] | Other[14] | No party preference[14] |
| Dorris | 872 | 42.5% | 30.5% | 42.3% | -11.8% | 8.4% | 22.4% |
| Dunsmuir | 1,663 | 56.2% | 41.5% | 24.5% | +17.0% | 13.7% | 24.6% |
| Etna | 721 | 58.5% | 29.1% | 46.0% | -16.9% | 9.7% | 18.7% |
| Fort Jones | 595 | 63.5% | 30.4% | 44.4% | -14.0% | 10.1% | 18.8% |
| Montague | 1,510 | 47.8% | 24.8% | 44.6% | -19.8% | 12.3% | 23.8% |
| Mount Shasta | 3,411 | 59.8% | 42.6% | 25.3% | +17.3% | 10.4% | 25.3% |
| Tulelake | 981 | 24.9% | 22.5% | 54.5% | -32.0% | 8.6% | 18.4% |
| Weed | 2,947 | 44.8% | 45.6% | 24.0% | +21.6% | 14.5% | 21.7% |
| Yreka | 7,696 | 52.3% | 30.8% | 42.5% | -11.7% | 11.0% | 20.3% |
Overview
Siskiyou is a strongly Republican county in Presidential and congressional elections. The last Democrat to win a majority in the county was Lyndon Johnson in 1964; however, Bill Clinton won a plurality of votes in 1992.
| Year | Republican | Democratic | Third party | |||
|---|---|---|---|---|---|---|
| No. | % | No. | % | No. | % | |
| 2020 | 13,290 | 56.62% | 9,593 | 40.87% | 589 | 2.51% |
| 2016 | 11,341 | 55.34% | 7,234 | 35.30% | 1,918 | 9.36% |
| 2012 | 11,077 | 55.40% | 8,046 | 40.24% | 870 | 4.35% |
| 2008 | 11,520 | 53.42% | 9,292 | 43.09% | 752 | 3.49% |
| 2004 | 12,673 | 60.64% | 7,880 | 37.71% | 346 | 1.66% |
| 2000 | 12,198 | 61.55% | 6,323 | 31.90% | 1,298 | 6.55% |
| 1996 | 8,653 | 47.30% | 7,022 | 38.39% | 2,618 | 14.31% |
| 1992 | 6,660 | 32.21% | 8,254 | 39.91% | 5,765 | 27.88% |
| 1988 | 9,056 | 50.88% | 8,365 | 47.00% | 376 | 2.11% |
| 1984 | 10,544 | 58.25% | 7,130 | 39.39% | 427 | 2.36% |
| 1980 | 9,331 | 55.75% | 5,664 | 33.84% | 1,743 | 10.41% |
| 1976 | 7,070 | 48.37% | 7,060 | 48.31% | 485 | 3.32% |
| 1972 | 7,563 | 51.46% | 6,434 | 43.78% | 699 | 4.76% |
| 1968 | 6,334 | 46.13% | 6,260 | 45.59% | 1,138 | 8.29% |
| 1964 | 5,186 | 36.18% | 9,126 | 63.66% | 23 | 0.16% |
| 1960 | 6,279 | 42.95% | 8,245 | 56.40% | 96 | 0.66% |
| 1956 | 6,841 | 49.79% | 6,837 | 49.76% | 63 | 0.46% |
| 1952 | 8,735 | 55.69% | 6,800 | 43.35% | 151 | 0.96% |
| 1948 | 5,315 | 42.53% | 6,749 | 54.00% | 434 | 3.47% |
| 1944 | 4,351 | 42.15% | 5,914 | 57.29% | 58 | 0.56% |
| 1940 | 4,387 | 35.92% | 7,714 | 63.17% | 111 | 0.91% |
| 1936 | 2,919 | 29.46% | 6,865 | 69.28% | 125 | 1.26% |
| 1932 | 2,458 | 26.76% | 6,367 | 69.33% | 359 | 3.91% |
| 1928 | 3,758 | 55.49% | 2,916 | 43.06% | 98 | 1.45% |
| 1924 | 2,437 | 40.58% | 584 | 9.73% | 2,984 | 49.69% |
| 1920 | 2,909 | 60.05% | 1,502 | 31.01% | 433 | 8.94% |
| 1916 | 2,059 | 34.13% | 3,447 | 57.15% | 526 | 8.72% |
| 1912 | 29 | 0.58% | 2,465 | 49.57% | 2,479 | 49.85% |
| 1908 | 1,813 | 47.40% | 1,657 | 43.32% | 355 | 9.28% |
| 1904 | 2,104 | 59.67% | 1,219 | 34.57% | 203 | 5.76% |
| 1900 | 1,898 | 52.36% | 1,668 | 46.01% | 59 | 1.63% |
| 1896 | 1,473 | 44.98% | 1,724 | 52.64% | 78 | 2.38% |
| 1892 | 1,493 | 46.27% | 1,605 | 49.74% | 129 | 4.00% |
Siskiyou County is in California's 1st congressional district, represented by Republican Doug LaMalfa.[16]
In the state legislature Siskiyou is in the 1st Senate District, represented by Republican Brian Dahle,[17] and the 1st Assembly District, represented by Republican Megan Dahle.[18]
On November 4, 2008, Siskiyou County voted 60.1% for Proposition 8 which amended the California Constitution to ban same-sex marriages. Dunsmuir and Mount Shasta voted against Prop 8. [citation needed]
On September 3, 2013, the Siskiyou County Board of Supervisors voted 4–1 in favor of secession from California to form a proposed state named Jefferson.[19][20] A similar move was made in 1941, but was shelved due to the attack on Pearl Harbor.[21]
Crime
The following table includes the number of incidents reported and the rate per 1,000 persons for each type of offense.
| Population and crime rates | ||
|---|---|---|
| Population[13] | 44,687 | |
| Violent crime[22] | 183 | 4.10 |
| Homicide[22] | 1 | 0.02 |
| Forcible rape[22] | 18 | 0.40 |
| Robbery[22] | 16 | 0.36 |
| Aggravated assault[22] | 148 | 3.31 |
| Property crime[22] | 447 | 10.00 |
| Burglary[22] | 257 | 5.75 |
| Larceny-theft[22][note 2] | 467 | 10.45 |
| Motor vehicle theft[22] | 82 | 1.83 |
| Arson[22] | 3 | 0.07 |
Cities by population and crime rates
| Cities by population and crime rates | ||||||||
|---|---|---|---|---|---|---|---|---|
| City | Population[23] | Violent crimes[23] | Violent crime rate per 1,000 persons | Property crimes[23] | Property crime rate per 1,000 persons | |||
| Dorris | 939 | 1 | 1.06 | 23 | 24.49 | |||
| Dunsmuir | 1,650 | 5 | 3.03 | 41 | 24.85 | |||
| Etna | 737 | 1 | 1.36 | 2 | 2.71 | |||
| Fort Jones | 841 | 0 | 0.00 | 14 | 16.65 | |||
| Lake Shastina | 2,460 | 0 | 0.00 | 0 | 0.00 | |||
| Montague | 1,443 | 2 | 1.39 | 6 | 4.16 | |||
| Mount Shasta | 3,396 | 5 | 1.47 | 79 | 23.26 | |||
| Tulelake | 1,010 | 1 | 0.99 | 5 | 4.95 | |||
| Weed | 2,970 | 18 | 6.06 | 125 | 42.09 | |||
| Yreka | 7,768 | 42 | 5.41 | 293 | 37.72 | |||
Demographics
2011
| Population, race, and income | |||||
|---|---|---|---|---|---|
| Total population[13] | 44,687 | ||||
| White[13] | 38,919 | 87.1% | |||
| Black or African American[13] | 519 | 1.2% | |||
| Native American or Alaska Native[13] | 1,287 | 2.9% | |||
| Asian[13] | 588 | 1.3% | |||
| Native Hawaiian or other Pacific Islander[13] | 142 | 0.3% | |||
| Some other race[13] | 516 | 1.2% | |||
| Two or more races[13] | 2,716 | 6.1% | |||
| Hispanic or Latino (of any race)[24] | 4,544 | 10.2% | |||
| Per capita income[25] | $22,335 | ||||
| Median household income[26] | $37,865 | ||||
| Median family income[27] | $47,632 | ||||
Places by population, race, and income
| Places by population and race | ||||||||
|---|---|---|---|---|---|---|---|---|
| Place | Type[28] | Population[13] | White[13] | Other[13] [note 3] | Asian[13] | Black or African American[13] | Native American[13] [note 4] | Hispanic or Latino (of any race)[24] |
| Carrick | CDP | 123 | 100.0% | 0.0% | 0.0% | 0.0% | 0.0% | 0.0% |
| Dorris | City | 872 | 83.9% | 11.6% | 1.0% | 0.0% | 3.4% | 25.1% |
| Dunsmuir | City | 1,663 | 85.9% | 8.5% | 1.5% | 1.6% | 2.4% | 7.5% |
| Edgewood | CDP | 49 | 85.7% | 14.3% | 0.0% | 0.0% | 0.0% | 14.3% |
| Etna | City | 721 | 86.8% | 10.1% | 0.6% | 0.0% | 2.5% | 9.3% |
| Fort Jones | City | 595 | 91.8% | 3.2% | 0.2% | 2.4% | 2.5% | 6.6% |
| Gazelle | CDP | 153 | 71.2% | 24.8% | 0.0% | 0.0% | 3.9% | 22.2% |
| Greenview | CDP | 376 | 89.4% | 10.6% | 0.0% | 0.0% | 0.0% | 0.0% |
| Grenada | CDP | 322 | 81.4% | 8.7% | 0.0% | 0.0% | 9.9% | 2.8% |
| Happy Camp | CDP | 1,170 | 61.3% | 12.2% | 6.9% | 0.8% | 18.8% | 4.6% |
| Hornbrook | CDP | 334 | 89.8% | 1.5% | 2.4% | 0.0% | 6.3% | 5.7% |
| McCloud | CDP | 1,288 | 94.5% | 1.6% | 2.2% | 0.8% | 1.0% | 5.1% |
| Macdoel | CDP | 108 | 38.0% | 62.0% | 0.0% | 0.0% | 0.0% | 72.2% |
| Montague | City | 1,510 | 80.7% | 12.5% | 0.6% | 0.2% | 6.0% | 16.9% |
| Mount Hebron | CDP | 72 | 94.4% | 0.0% | 0.0% | 0.0% | 5.6% | 31.9% |
| Mount Shasta | City | 3,411 | 93.3% | 6.5% | 0.0% | 0.2% | 0.0% | 8.6% |
| Tennant | CDP | 55 | 65.5% | 5.5% | 29.1% | 0.0% | 0.0% | 0.0% |
| Tulelake | City | 981 | 83.1% | 8.1% | 1.0% | 5.2% | 2.7% | 55.2% |
| Weed | City | 2,947 | 87.8% | 5.0% | 1.1% | 3.7% | 2.5% | 15.8% |
| Yreka | City | 7,696 | 84.6% | 8.9% | 1.9% | 1.3% | 3.4% | 10.3% |
| Places by population and income | |||||
|---|---|---|---|---|---|
| Place | Type[28] | Population[29] | Per capita income[25] | Median household income[26] | Median family income[27] |
| Carrick | CDP | 123 | $13,418 | $12,269 | $37,386 |
| Dorris | City | 872 | $15,058 | $32,500 | $37,880 |
| Dunsmuir | City | 1,663 | $21,465 | $36,813 | $47,958 |
| Edgewood | CDP | 49 | $26,247 | $44,063 | $43,438 |
| Etna | City | 721 | $16,854 | $30,455 | $31,875 |
| Fort Jones | City | 595 | $15,363 | $26,875 | $38,947 |
| Gazelle | CDP | 153 | $13,808 | $19,333 | $27,344 |
| Greenview | CDP | 376 | $19,574 | $45,640 | $45,640 |
| Grenada | CDP | 322 | $21,354 | $27,955 | $40,417 |
| Happy Camp | CDP | 1,170 | $13,909 | $23,438 | $30,500 |
| Hornbrook | CDP | 334 | $13,494 | $27,143 | $36,528 |
| McCloud | CDP | 1,288 | $19,543 | $31,630 | $49,922 |
| Macdoel | CDP | 108 | $17,961 | $51,534 | $53,750 |
| Montague | City | 1,510 | $15,971 | $33,438 | $44,875 |
| Mount Hebron | CDP | 72 | $18,090 | $25,875 | $24,464 |
| Mount Shasta | City | 3,411 | $24,705 | $39,575 | $62,500 |
| Tennant | CDP | 55 | $13,035 | $18,365 | $18,250 |
| Tulelake | City | 981 | $13,174 | $26,389 | $36,500 |
| Weed | City | 2,947 | $15,124 | $25,659 | $37,917 |
| Yreka | City | 7,696 | $21,169 | $31,151 | $41,750 |
2010
| Census | Pop. | Note | %± |
|---|---|---|---|
| 1860 | 7,629 | — | |
| 1870 | 6,848 | −10.2% | |
| 1880 | 8,610 | 25.7% | |
| 1890 | 12,163 | 41.3% | |
| 1900 | 16,962 | 39.5% | |
| 1910 | 18,801 | 10.8% | |
| 1920 | 18,545 | −1.4% | |
| 1930 | 25,480 | 37.4% | |
| 1940 | 28,598 | 12.2% | |
| 1950 | 30,733 | 7.5% | |
| 1960 | 32,885 | 7.0% | |
| 1970 | 33,225 | 1.0% | |
| 1980 | 39,732 | 19.6% | |
| 1990 | 43,531 | 9.6% | |
| 2000 | 44,301 | 1.8% | |
| 2010 | 44,900 | 1.4% | |
| 2020 | 44,076 | −1.8% | |
| 2023 (est.) | 42,905 | [30] | −2.7% |
| U.S. Decennial Census[31] 1790-1960[32] 1900-1990[33] 1990-2000[34] 2010-2015[3] | |||
The 2010 United States Census reported Siskiyou County had a population of 44,900. The racial makeup of Siskiyou County was 38,030 (84.7%) White, 571 (1.3%) African American, 1,814 (4.0%) Native American, 540 (1.2%) Asian, 80 (0.2%) Pacific Islander, 1,491 (3.3%) from other races, and 2,374 (5.3%) from two or more races. Hispanic or Latino of any race were 4,615 persons (10.3%).[35]
| Population reported at 2010 United States Census | |||||||||
|---|---|---|---|---|---|---|---|---|---|
The County | Total Population | White | African American | Native American | Asian | Pacific Islander | other races | two or more races | Hispanic or Latino (of any race) |
| Siskiyou County | 44,900 | 38,030 | 571 | 1,814 | 540 | 80 | 1,491 | 2,374 | 4,615 |
Incorporated cities and towns | Total Population | White | African American | Native American | Asian | Pacific Islander | other races | two or more races | Hispanic or Latino (of any race) |
| Dorris | 939 | 764 | 19 | 18 | 5 | 8 | 77 | 48 | 197 |
| Dunsmuir | 1,650 | 1,443 | 32 | 17 | 15 | 4 | 30 | 109 | 167 |
| Etna | 737 | 627 | 0 | 28 | 1 | 1 | 6 | 74 | 26 |
| Fort Jones | 839 | 650 | 33 | 61 | 8 | 0 | 23 | 64 | 103 |
| Montague | 1,443 | 1,251 | 4 | 67 | 8 | 1 | 17 | 95 | 107 |
| Mount Shasta | 3,394 | 3,041 | 61 | 19 | 56 | 2 | 51 | 164 | 277 |
| Tulelake | 1,010 | 563 | 1 | 15 | 1 | 0 | 365 | 65 | 601 |
| Weed | 2,967 | 2,221 | 206 | 70 | 121 | 27 | 132 | 190 | 475 |
| Yreka | 7,765 | 6,495 | 57 | 491 | 94 | 9 | 168 | 451 | 753 |
Census-designated places | Total Population | White | African American | Native American | Asian | Pacific Islander | other races | two or more races | Hispanic or Latino (of any race) |
| Carrick | 131 | 110 | 7 | 2 | 2 | 0 | 1 | 9 | 8 |
| Edgewood | 43 | 41 | 0 | 0 | 0 | 0 | 1 | 1 | 2 |
| Gazelle | 70 | 65 | 0 | 4 | 0 | 0 | 1 | 0 | 5 |
| Greenview | 201 | 161 | 0 | 10 | 1 | 0 | 8 | 21 | 19 |
| Grenada | 367 | 307 | 2 | 35 | 1 | 0 | 3 | 19 | 12 |
| Happy Camp | 1,190 | 814 | 2 | 277 | 7 | 1 | 18 | 71 | 95 |
| Hornbrook | 248 | 195 | 0 | 15 | 0 | 0 | 10 | 28 | 19 |
| Macdoel | 133 | 57 | 0 | 6 | 0 | 0 | 69 | 1 | 78 |
| McCloud | 1,101 | 1,039 | 8 | 10 | 6 | 0 | 5 | 33 | 65 |
| Mount Hebron | 95 | 73 | 0 | 1 | 0 | 0 | 18 | 3 | 41 |
| Tennant | 41 | 36 | 0 | 2 | 0 | 0 | 1 | 2 | 4 |
Other unincorporated areas | Total Population | White | African American | Native American | Asian | Pacific Islander | other races | two or more races | Hispanic or Latino (of any race) |
| All others not CDPs (combined) | 20,536 | 18,077 | 139 | 666 | 214 | 27 | 487 | 926 | 1,561 |
2000
As of the census[36] of 2000, there were 44,301 people, 18,556 households, and 12,228 families residing in the county. The population density was 7 per square mile (2.7/km2). There were 21,947 housing units at an average density of 4 per square mile (1.5/km2). The racial makeup of the county was 87.1% White, 1.3% Black or African American, 3.9% Native American, 1.2% Asian, 0.1% Pacific Islander, 2.8% from other races, and 3.7% from two or more races. 7.6% of the population were Hispanic or Latino of any race. 13.5% were of German, 12.0% English, 9.8% Irish, 9.5% American and 7.1% Italian ancestry according to Census 2000. 91.7% spoke English and 5.7% Spanish as their first language. As of March 2012, the largest self-reported ancestry groups in Siskiyou County are 15% German, 13% English, 12% Irish and 6% Italian.[37]
There were 18,556 households, out of which 27.6% had children under the age of 18 living with them, 51.7% were married couples living together, 10.1% had a female householder with no husband present, and 34.1% were non-families. 28.6% of all households were made up of individuals, and 12.8% had someone living alone who was 65 years of age or older. The average household size was 2.35 and the average family size was 2.87.
In the county, the population was spread out, with 24.0% under the age of 18, 6.7% from 18 to 24, 22.7% from 25 to 44, 28.4% from 45 to 64, and 18.1% who were 65 years of age or older. The median age was 43 years. For every 100 females there were 96.5 males. For every 100 females age 18 and over, there were 94.1 males.
The median income for a household in the county was $29,530, and the median income for a family was $36,890. Males had a median income of $31,936 versus $22,650 for females. The per capita income for the county was $17,570. About 14.0% of families and 18.6% of the population were below the poverty line, including 26.6% of those under age 18 and 7.3% of those age 65 or over.
Communities
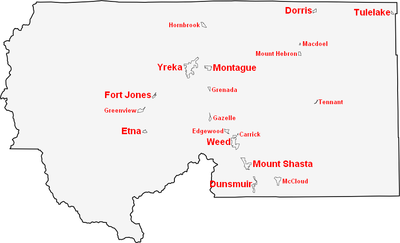
Cities
- Dorris
- Dunsmuir
- Etna
- Fort Jones
- Montague
- Mount Shasta
- Tulelake
- Weed
- Yreka (county seat)
Census-designated places
Other unincorporated communities
Ghost towns
Population ranking
The population ranking of the following table is based on the 2020 census of Siskiyou County.
† county seat
| Rank | City/Town/etc. | Municipal type | Population (2020 Census) |
|---|---|---|---|
| 1 | † Yreka | City | 7,807 |
| 2 | Mount Shasta | City | 3,223 |
| 3 | Weed | City | 2,862 |
| 4 | Lake Shastina | CDP | 2,401 |
| 5 | Dunsmuir | City | 1,707 |
| 6 | Montague | City | 1,226 |
| 7 | McCloud | CDP | 945 |
| 8 | Happy Camp | CDP | 905 |
| 9 | Tulelake | City | 902 |
| 10 | Dorris | City | 860 |
| 11 | Fort Jones | City | 695 |
| 12 | Etna | City | 678 |
| 13 | Karuk Reservation[38] | AIAN | 578 |
| 14 | Grenada | CDP | 314 |
| 15 | Hornbrook | CDP | 266 |
| 16 | Greenview | CDP | 208 |
| 17 | Quartz Valley Reservation[39] | AIAN | 202 |
| 18 | Carrick | CDP | 143 |
| 19 | Mount Hebron | CDP | 103 |
| 20 | Gazelle | CDP | 95 |
| 21 | Macdoel | CDP | 86 |
| 22 | Edgewood | CDP | 72 |
| 23 | Tennant | CDP | 63 |
See also
- List of school districts in Siskiyou County, California
- List of museums in the Shasta Cascade (California)
- National Register of Historic Places listings in Siskiyou County, California
- Upper Soda Springs
- Shasta Springs
- Yreka Western Railroad
Notes
- ^ a b Percentage of registered voters with respect to total population. Percentages of party members with respect to registered voters follow.
- ^ Only larceny-theft cases involving property over $400 in value are reported as property crimes.
- ^ Other = Some other race + Two or more races
- ^ Native American = Native Hawaiian or other Pacific Islander + American Indian or Alaska Native
References
- ^ "Board of Supervisors | Siskiyou County California". www.co.siskiyou.ca.us.
- ^ "Mount Shasta". Peakbagger.com. Retrieved February 2, 2015.
- ^ a b c "State & County QuickFacts". United States Census Bureau. Retrieved December 6, 2021.
- ^ "Find a County". National Association of Counties. Retrieved June 7, 2011.
- ^ "Boundaries". Cascadia Institute. Retrieved August 27, 2021.
- ^ Golla, Victor (February 2022). California Indian Languages. Univ of California Press. p. 236. ISBN 9780520389670.
- ^ "Siskiyou County supervisors vote to pursue seceding from state", The Record Searchlight, redding.com, September 4, 2013
- ^ "US Gazetteer files: 2010, 2000, and 1990". United States Census Bureau. February 12, 2011. Retrieved April 23, 2011.
- ^ "Siskiyou Archives". FishingWorks. Archived from the original on October 29, 2013.
- ^ C. Michael Hogan (2008) Aesculus californica, Globaltwitcher.com, ed. N. Stromberg Archived November 22, 2012, at the Wayback Machine
- ^ Siskiyou County factsheet Archived October 11, 2006, at the Wayback Machine
- ^ "STAGE". Transit.wiki. Retrieved January 1, 2023.
- ^ a b c d e f g h i j k l m n o p q U.S. Census Bureau. American Community Survey, 2011 American Community Survey 5-Year Estimates, Table B02001. U.S. Census website. Retrieved 2013-10-26.
- ^ a b c d e f g h i j k l m n o p q California Secretary of State. February 10, 2013 - Report of Registration Archived July 27, 2013, at the Wayback Machine. Retrieved 2013-10-31.
- ^ Leip, David. "Dave Leip's Atlas of U.S. Presidential Elections". uselectionatlas.org.
- ^ "California's 1st Congressional District - Representatives & District Map". Civic Impulse, LLC. Retrieved February 28, 2013.
- ^ "Senators". State of California. Retrieved March 10, 2013.
- ^ "Members Assembly". State of California. Retrieved March 2, 2013.
- ^ Longoria, Sean, Siskiyou supervisors support withdrawal from California Archived June 20, 2014, at the Wayback Machine, Redding Record Searchlight, September 4, 2013, accessed September 4, 2013
- ^ Mather, Kate, Siskiyou County votes to pursue secession from California, Los Angeles Times, September 4, 2013, accessed September 4, 2013
- ^ Northern California County Board Votes For Secession From State, CBS, San Francisco, September 4, 2013
- ^ a b c d e f g h i j Office of the Attorney General, Department of Justice, State of California. Table 11: Crimes – 2009. Retrieved 2013-11-14. Archived December 2, 2013, at the Wayback Machine
- ^ a b c United States Department of Justice, Federal Bureau of Investigation. Crime in the United States, 2012, Table 8 (California). Retrieved 2013-11-14.
- ^ a b U.S. Census Bureau. American Community Survey, 2011 American Community Survey 5-Year Estimates, Table B03003. U.S. Census website. Retrieved 2013-10-26.
- ^ a b U.S. Census Bureau. American Community Survey, 2011 American Community Survey 5-Year Estimates, Table B19301. U.S. Census website. Retrieved 2013-10-21.
- ^ a b U.S. Census Bureau. American Community Survey, 2011 American Community Survey 5-Year Estimates, Table B19013. U.S. Census website. Retrieved 2013-10-21.
- ^ a b U.S. Census Bureau. American Community Survey, 2011 American Community Survey 5-Year Estimates, Table B19113. U.S. Census website. Retrieved 2013-10-21.
- ^ a b U.S. Census Bureau. American Community Survey, 2011 American Community Survey 5-Year Estimates. U.S. Census website. Retrieved 2013-10-21.
- ^ U.S. Census Bureau. American Community Survey, 2011 American Community Survey 5-Year Estimates, Table B01003. U.S. Census website. Retrieved 2013-10-21.
- ^ "Annual Estimates of the Resident Population for Counties: April 1, 2020 to July 1, 2023". United States Census Bureau. Retrieved March 26, 2024.
- ^ "U.S. Decennial Census". United States Census Bureau. Retrieved May 31, 2014.
- ^ "Historical Census Browser". University of Virginia Library. Retrieved May 31, 2014.
- ^ "Population of Counties by Decennial Census: 1900 to 1990". United States Census Bureau. Retrieved May 31, 2014.
- ^ "Census 2000 PHC-T-4. Ranking Tables for Counties: 1990 and 2000" (PDF). United States Census Bureau. Retrieved May 31, 2014.
- ^ "2010 Census P.L. 94-171 Summary File Data". United States Census Bureau.
- ^ "U.S. Census website". United States Census Bureau. Retrieved May 14, 2011.
- ^ "Siskiyou County, CA - Siskiyou County, California - Ancestry & family history - ePodunk". www.epodunk.com. Archived from the original on April 22, 2014. Retrieved March 30, 2012.
- ^ Staff, Website Services & Coordination. "U.S. Census Bureau 2020 Census". www.census.gov.
- ^ Staff, Website Services & Coordination. "U.S. Census Bureau 2020 Census". www.census.gov.
Further reading
- Harry L. Wells, History of Siskiyou County, California: Illustrated with Views of Residences, Business Buildings and Natural Scenery and Containing Portraits and Biographies of Its Leading Citizens and Pioneers. Oakland, CA: D.J. Stewart and Co., 1881.
External links
Wikimedia Commons has media related to Siskiyou County, California.
- Official website

- Museum of the Siskiyou Trail
- Siskiyou County Visitors Bureau
Places adjacent to Siskiyou County, California | ||||||||||||||||
|---|---|---|---|---|---|---|---|---|---|---|---|---|---|---|---|---|
| ||||||||||||||||


- v
- t
- e
Municipalities and communities of Siskiyou County, California, United States
County seat: Yreka
communities
‡This populated place also has portions in an adjacent county or counties
- California portal
- United States portal

Authority control databases | |
|---|---|
| International |
|
| National |
|
| Geographic |
|
| Other |
|


