2010 Illinois elections
|
| ← 2008 | November 2, 2010 | 2012 → |
|
| Turnout | 50.53% |
|---|
| |
| Elections in Illinois |
|---|
 |
| |
| General elections |
|---|
| | | Gubernatorial elections |
|---|
| | | Lieutenant Gubernatorial elections |
|---|
| | | Attorney General elections |
|---|
| | | Secretary of State elections |
|---|
| | | Comptroller elections |
|---|
| | | Senate elections |
|---|
| | | House of Representatives elections |
|---|
| | | Judicial elections |
|---|
| |
|
Ballot measures and referendums |
| |
| |
| |
|
Elections were held in Illinois on Tuesday, November 2, 2010. Primary elections were held on February 2, 2010.
Election information
2010 was a midterm election year in the United States.
Turnout
Primary election
For the primary election, turnout was 23.14%, with 1,758,489 votes cast.[1]
- Turnout by county[1]
| County | Registration | Votes cast | Turnout |
| Adams | 45,182 | 7,655 | 16.94% |
| Alexander | 7,942 | 1,727 | 21.75% |
| Bond | 11,734 | 1,786 | 15.22% |
| Boone | 33,048 | 6,596 | 19.96% |
| Brown | 3,852 | 832 | 21.6% |
| Bureau | 23,216 | 4,034 | 17.38% |
| Calhoun | 3,766 | 1,901 | 50.48% |
| Carroll | 12,139 | 2,814 | 23.18% |
| Cass | 9,553 | 3,584 | 37.52% |
| Champaign | 117,991 | 22,466 | 19.04% |
| Christian | 22,459 | 7,068 | 31.47% |
| Clark | 12,821 | 2,279 | 17.78% |
| Clay | 9,798 | 1,942 | 19.82% |
| Clinton | 25,528 | 3,422 | 13.4% |
| Coles | 30,412 | 8,957 | 29.45% |
| Cook[note 1] | 2,883,692 | 761,626 | 26.41% |
| Crawford | 14,324 | 2,286 | 15.96% |
| Cumberland | 9,048 | 2,272 | 25.11% |
| DeKalb | 56,012 | 14,024 | 25.04% |
| DeWitt | 11,689 | 3,856 | 32.99% |
| Douglas | 11,722 | 4,184 | 35.69% |
| DuPage | 548,771 | 136,750 | 24.92% |
| Edgar | 13,170 | 3,004 | 22.81% |
| Edwards | 4,689 | 943 | 20.11% |
| Effingham | 22,187 | 5,666 | 25.54% |
| Fayette | 15,289 | 2,891 | 18.91% |
| Ford | 8,710 | 2,834 | 32.54% |
| Franklin | 31,891 | 8,752 | 27.44% |
| Fulton | 24,642 | 5,772 | 23.42% |
| Gallatin | 4,237 | 1,991 | 46.99% |
| Greene | 8,615 | 2,223 | 25.8% |
| Grundy | 30,933 | 6,952 | 22.47% |
| Hamilton | 5,781 | 1,849 | 31.98% |
| Hancock | 13,496 | 2,610 | 19.34% |
| Hardin | 3,709 | 1,437 | 38.74% |
| Henderson | 5,179 | 1,447 | 27.94% |
| Henry | 37,309 | 8,438 | 22.62% |
| Iroquois | 19,277 | 7,674 | 39.81% |
| Jackson | 36,567 | 6,873 | 18.8% |
| Jasper | 7,505 | 2,350 | 31.31% |
| Jefferson | 24,172 | 4,624 | 19.13% |
| Jersey | 17,041 | 2,625 | 15.4% |
| Jo Daviess | 16,321 | 4,044 | 24.78% |
| Johnson | 7,876 | 3,029 | 38.46% |
| Kane | 264,600 | 52,530 | 19.85% |
| Kankakee | 67,614 | 11,056 | 16.35% |
| Kendall | 60,295 | 13,459 | 22.32% |
| Knox | 33,720 | 6,226 | 18.46% |
| Lake | 401,680 | 83,908 | 20.89% |
| LaSalle | 71,815 | 15,314 | 21.32% |
| Lawrence | 10,640 | 3,134 | 29.45% |
| Lee | 25,107 | 4,543 | 18.09% |
| Livingston | 21,477 | 7,776 | 36.21% |
| Logan | 19,999 | 5,417 | 27.09% |
| Macon | 71,226 | 13,303 | 18.68% |
| Macoupin | 34,040 | 8,107 | 23.82% |
| Madison | 173,397 | 27,383 | 15.79% |
| Marion | 27,689 | 6,744 | 24.36% |
| Marshall | 8,510 | 1,922 | 22.59% |
| Mason | 10,502 | 2,015 | 19.19% |
| Massac | 12,104 | 2,303 | 19.03% |
| McDonough | 16,762 | 4,206 | 25.09% |
| McHenry | 200,688 | 36,078 | 17.98% |
| McLean | 95,280 | 21,257 | 22.31% |
| Menard | 9,701 | 2,083 | 21.47% |
| Mercer | 14,288 | 2,348 | 16.43% |
| Monroe | 22,962 | 4,276 | 18.62% |
| Montgomery | 17,667 | 5,223 | 29.56% |
| Morgan | 23,096 | 4,620 | 20% |
| Moultrie | 8,967 | 2,239 | 24.97% |
| Ogle | 40,360 | 8,881 | 22% |
| Peoria | 110,919 | 22,637 | 20.41% |
| Perry | 14,928 | 3,710 | 24.85% |
| Piatt | 12,079 | 4,024 | 33.31% |
| Pike | 10,723 | 2,232 | 20.82% |
| Pope | 3,376 | 1,388 | 41.11% |
| Pulaski | 7,157 | 1,470 | 20.54% |
| Putnam | 4,228 | 1,530 | 36.19% |
| Randolph | 20,725 | 4,543 | 21.92% |
| Richland | 13,644 | 2,264 | 16.59% |
| Rock Island | 124,361 | 18,224 | 14.65% |
| Saline | 16,366 | 3,591 | 21.94% |
| Sangamon | 133,469 | 25,838 | 19.36% |
| Schuyler | 5,522 | 1,271 | 23.02% |
| Scott | 3,942 | 836 | 21.21% |
| Shelby | 15,465 | 3,639 | 23.53% |
| Stark | 4,747 | 1,369 | 28.84% |
| St. Clair | 186,372 | 32,986 | 17.7% |
| Stephenson | 34,480 | 6,303 | 18.28% |
| Tazewell | 87,517 | 18,751 | 21.43% |
| Union | 15,280 | 4,086 | 26.74% |
| Vermilion | 47,735 | 8,598 | 18.01% |
| Wabash | 9,515 | 1,351 | 14.2% |
| Warren | 11,261 | 2,598 | 23.07% |
| Washington | 9,720 | 3,399 | 34.97% |
| Wayne | 12,490 | 5,201 | 41.64% |
| White | 11,515 | 1,790 | 15.54% |
| Whiteside | 39,407 | 5,635 | 14.3% |
| Will | 360,651 | 79,000 | 21.9% |
| Williamson | 41,960 | 10,324 | 24.6% |
| Winnebago | 178,992 | 27,115 | 15.15% |
| Woodford | 24,935 | 6,346 | 25.45% |
| Total | 7,600,962 | 1,758,489 | 23.14% |
General election
For the general election, turnout was 50.53%, with 3,792,770 votes cast.[2]
- Turnout by county[2]
| County | Registration | Votes cast | Turnout |
| Adams | 44,891 | 24,125 | 53.74% |
| Alexander | 7,806 | 2,910 | 37.28% |
| Bond | 11,886 | 5,618 | 47.27% |
| Boone | 33,464 | 15,111 | 45.16% |
| Brown | 3,489 | 2,227 | 63.83% |
| Bureau | 23,782 | 12,969 | 54.53% |
| Calhoun | 3,817 | 2,418 | 63.35% |
| Carroll | 11,895 | 5,242 | 44.07% |
| Cass | 9,830 | 3,964 | 40.33% |
| Champaign | 122,441 | 54,818 | 44.77% |
| Christian | 22,692 | 12,780 | 56.32% |
| Clark | 12,914 | 6,236 | 48.29% |
| Clay | 9,850 | 4,992 | 50.68% |
| Clinton | 32,161 | 13,205 | 41.06% |
| Coles | 31,489 | 15,087 | 47.91% |
| Cook[note 2] | 2,704,993 | 1,424,959 | 52.68% |
| Crawford | 14,133 | 7,020 | 49.67% |
| Cumberland | 7,708 | 4,393 | 56.99% |
| DeKalb | 57,102 | 29,197 | 51.13% |
| DeWitt | 11,733 | 5,815 | 49.56% |
| Douglas | 11,980 | 6,545 | 54.63% |
| DuPage | 558,929 | 288,680 | 51.65% |
| Edgar | 13,238 | 7,143 | 53.96% |
| Edwards | 4,622 | 2,296 | 49.68% |
| Effingham | 22,838 | 13,202 | 57.81% |
| Fayette | 15,406 | 6,891 | 44.73% |
| Ford | 8,908 | 4,699 | 52.75% |
| Franklin | 29,513 | 13,334 | 45.18% |
| Fulton | 24,904 | 11,833 | 47.51% |
| Gallatin | 4,234 | 2,299 | 54.3% |
| Greene | 8,753 | 4,540 | 51.87% |
| Grundy | 29,708 | 16,973 | 57.13% |
| Hamilton | 5,853 | 3,644 | 62.26% |
| Hancock | 13,461 | 6,943 | 51.58% |
| Hardin | 3,833 | 2,194 | 57.24% |
| Henderson | 5,231 | 3,574 | 68.32% |
| Henry | 35,322 | 18,444 | 52.22% |
| Iroquois | 19,847 | 10,703 | 53.93% |
| Jackson | 42,164 | 16,696 | 39.6% |
| Jasper | 7,586 | 4,126 | 54.39% |
| Jefferson | 24,750 | 12,663 | 51.16% |
| Jersey | 17,250 | 7,825 | 45.36% |
| Jo Daviess | 16,347 | 8,279 | 50.65% |
| Johnson | 8,083 | 4,777 | 59.1% |
| Kane | 260,429 | 129,050 | 49.55% |
| Kankakee | 64,306 | 32,999 | 51.32% |
| Kendall | 65,153 | 31,538 | 48.41% |
| Knox | 34,258 | 16,943 | 49.46% |
| Lake | 404,637 | 207,499 | 51.28% |
| LaSalle | 73,051 | 34,423 | 47.12% |
| Lawrence | 10,770 | 5,314 | 49.34% |
| Lee | 25,723 | 11,075 | 43.05% |
| Livingston | 21,968 | 12,844 | 58.47% |
| Logan | 20,088 | 9,008 | 44.84% |
| Macon | 72,975 | 37,186 | 50.96% |
| Macoupin | 34,443 | 16,809 | 48.8% |
| Madison | 177,371 | 83,208 | 46.91% |
| Marion | 28,274 | 12,227 | 43.24% |
| Marshall | 8,613 | 4,379 | 50.84% |
| Mason | 10,510 | 4,995 | 47.53% |
| Massac | 12,350 | 5,047 | 40.87% |
| McDonough | 17,909 | 9,433 | 52.67% |
| McHenry | 202,033 | 95,339 | 47.19% |
| McLean | 97,274 | 52,944 | 54.43% |
| Menard | 9,744 | 4,951 | 50.81% |
| Mercer | 14,295 | 6,892 | 48.21% |
| Monroe | 23,792 | 12,037 | 50.59% |
| Montgomery | 18,162 | 9,911 | 54.57% |
| Morgan | 22,816 | 10,978 | 48.12% |
| Moultrie | 8,904 | 4,964 | 55.75% |
| Ogle | 40,973 | 17,461 | 42.62% |
| Peoria | 121,725 | 53,848 | 44.24% |
| Perry | 14,989 | 7,663 | 51.12% |
| Piatt | 11,990 | 6,895 | 57.51% |
| Pike | 11,418 | 6,525 | 57.15% |
| Pope | 3,397 | 2,089 | 61.5% |
| Pulaski | 5,961 | 2,972 | 49.86% |
| Putnam | 4,296 | 2,371 | 55.19% |
| Randolph | 21,130 | 11,902 | 56.33% |
| Richland | 13,826 | 5,217 | 37.73% |
| Rock Island | 125,875 | 47,053 | 37.38% |
| Saline | 16,780 | 8,292 | 49.42% |
| Sangamon | 136,649 | 74,124 | 54.24% |
| Schuyler | 5,618 | 3,035 | 54.02% |
| Scott | 3,996 | 1,828 | 45.75% |
| Shelby | 15,610 | 8,309 | 53.23% |
| Stark | 4,752 | 1,969 | 41.44% |
| St. Clair | 194,486 | 82,250 | 42.29% |
| Stephenson | 34,930 | 15,008 | 42.97% |
| Tazewell | 89,514 | 46,268 | 51.69% |
| Union | 15,156 | 6,745 | 44.5% |
| Vermilion | 48,711 | 22,833 | 46.87% |
| Wabash | 9,242 | 4,057 | 43.9% |
| Warren | 11,953 | 6,134 | 51.32% |
| Washington | 10,662 | 5,979 | 56.08% |
| Wayne | 12,689 | 6,983 | 55.03% |
| White | 11,598 | 5,361 | 46.22% |
| Whiteside | 38,300 | 19,240 | 50.23% |
| Will | 371,079 | 196,857 | 53.05% |
| Williamson | 43,569 | 22,735 | 52.18% |
| Winnebago | 179,182 | 83,229 | 46.45% |
| Woodford | 25,333 | 14,156 | 55.88% |
| Total | 7,506,073 | 3,792,770 | 50.53% |
Federal elections
United States Senate
Incumbent Democrat Roland Burris, appointed in 2009 by then-Governor Rod Blagojevich to fill the U.S. Senate seat that Barack Obama had vacated after being elected President of the United States, did not seek reelection.
U.S. Congressman Mark Kirk (Republican Party) won against State Treasurer Alexi Giannoulias (Democratic Party), Mike Labno (Libertarian Party), and football coach LeAlan Jones (Green Party) in both a regular election for the Senate seat and a coinciding special election to fill the remainder of Barack Obama's unexpired term.
United States House
All Illinois seats in the United States House of Representatives were up for election in 2010.
The Republican Party flipped four Democratic-held seats, making the composition of Illinois' House delegation 11 Republicans and 8 Democrats.
State elections
Governor and lieutenant governor
2010 Illinois gubernatorial election
|
|
| Turnout | 49.69% |
|---|
| |  |  | | Nominee | Pat Quinn | Bill Brady | | | Party | Democratic | Republican | | Running mate | Sheila Simon | Jason Plummer | | Popular vote | 1,745,219 | 1,713,385 | | Percentage | 46.79% | 45.94% | |
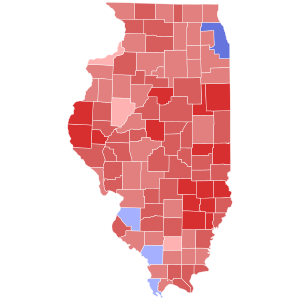 County results
Quinn: 40–50% 60–70%
Brady: 40–50% 50–60% 60–70% 70–80% |
Governor before election
Pat Quinn
Democratic | Elected Governor
Pat Quinn
Democratic | |
Incumbent Governor Pat Quinn, who became governor after Rod Blagojevich was removed from office, was elected outright to his first full term.
Governor/Lieutenant Governor election[3] | Party | Candidate | Votes | % |
| | Democratic | Pat Quinn (incumbent) / Sheila Simon | 1,745,219 | 46.79 |
| | Republican | Bill Brady / Jason Plummer | 1,713,385 | 45.94 |
| | Independent | Scott Lee Cohen / Baxter B. Swilley | 135,705 | 3.64 |
| | Green | Rich Whitney / Don W. Crawford | 100,756 | 2.70 |
| | Libertarian | Lex Green / Ed Rutledge | 34,681 | 0.93 |
| | Write-in | Others | 243 | 0.01 |
| Total votes | 3,729,989 | 100 |
Attorney general
Incumbent Democratic attorney general Lisa Madigan won reelection to a third term in office
Democratic primary
Attorney General Democratic primary[3] | Party | Candidate | Votes | % |
| | Democratic | Lisa Madigan (incumbent) | 838,605 | 100 |
| Total votes | 838,605 | 100 |
Republican primary
Attorney General Republican primary[3] | Party | Candidate | Votes | % |
| | Republican | Steve Kim | 641,689 | 100 |
| Total votes | 641,689 | 100 |
Green primary
Attorney General Green primary[3] | Party | Candidate | Votes | % |
| | Green | David F. Black | 4,917 | 100 |
| Total votes | 4,917 | 100 |
General election
Attorney General election[3] | Party | Candidate | Votes | % |
| | Democratic | Lisa Madigan (incumbent) | 2,397,723 | 64.72 |
| | Republican | Steve Kim | 1,172,427 | 31.65 |
| | Green | David F. Black | 80,004 | 2.16 |
| | Libertarian | Bill Malan | 54,532 | 1.47 |
| Total votes | 3,704,686 | 100 |
Secretary of state
2010 Illinois Secretary of State election
|
|
| Turnout | 49.39% |
|---|
| |  |  | | Nominee | Jesse White | Robert Enriquez | | | Party | Democratic | Republican | | Popular vote | 2,590,222 | 1,001,544 | | Percentage | 69.87% | 27.02% | |
 County results
White: 40–50% 50–60% 60–70% 70–80% 80–90%
Enriquez: 40–50% 50–60% |
Secretary of State before election
Jesse White
Democratic | Elected Secretary of State
Jesse White
Democratic | |
Incumbent Democratic Secretary of State Jesse White won reelection to a fourth term in office.
Democratic primary
Secretary of State Democratic primary[3] | Party | Candidate | Votes | % |
| | Democratic | Jesse White (incumbent) | 854,408 | 100 |
| Total votes | 854,408 | 100 |
Republican primary
Secretary of State Republican primary[3] | Party | Candidate | Votes | % |
| | Republican | Robert Enriquez | 627,224 | 100 |
| Total votes | 627,224 | 100 |
Green primary
Secretary of State Green primary[3] | Party | Candidate | Votes | % |
| | Green | Adrian Frost | 4,931 | 100 |
| Total votes | 4,931 | 100 |
General election
Green Party nominee Adrian Frost withdrew before the election.
Secretary of State election[3] | Party | Candidate | Votes | % |
| | Democratic | Jesse White (incumbent) | 2,590,222 | 69.87 |
| | Republican | Robert Enriquez | 1,001,544 | 27.02 |
| | Libertarian | Josh Hanson | 115,458 | 3.11 |
| Total votes | 3,707,224 | 100 |
Comptroller
2010 Illinois State Comptroller election
|
|
| Turnout | 48.79% |
|---|
| |
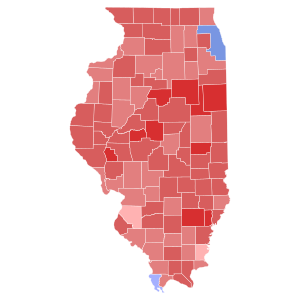 County results
Topinka: 40–50% 50–60% 60–70% 70–80%
Miller: 40–50% 50–60% |
|
Incumbent Comptroller Daniel Hynes, a Democrat, did not seek a fourth term. Republican Judy Baar Topinka was elected to succeed him.
Democratic primary
Comptroller Democratic primary[3] | Party | Candidate | Votes | % |
| | Democratic | David E. Miller | 393,405 | 46.71 |
| | Democratic | S. Raja Krishnamoorthi | 384,796 | 45.68 |
| | Democratic | Clinton A. "Clint" Krislov | 64,086 | 7.61 |
| Total votes | 842,287 | 100 |
Republican primary
Comptroller Republican primary[3] | Party | Candidate | Votes | % |
| | Republican | Judy Baar Topinka | 430,996 | 59.19 |
| | Republican | William J. Kelly | 157,774 | 21.67 |
| | Republican | Jim Dodge | 139,336 | 19.14 |
| Total votes | 728,106 | 100 |
Green primary
Comptroller Green primary[3] | Party | Candidate | Votes | % |
| | Green | R. Erika Schafer | 4,908 | 100 |
| Total votes | 4,908 | 100 |
General election
Comptroller election[3] | Party | Candidate | Votes | % |
| | Republican | Judy Baar Topinka | 1,927,139 | 52.62 |
| | Democratic | David E. Miller | 1,497,263 | 40.88 |
| | Libertarian | Julie Fox | 121,068 | 3.31 |
| | Green | R. Erika Schafer | 116,712 | 3.19 |
| Total votes | 3,662,182 | 100 |
Treasurer
2010 Illinois State Treasurer election
|
|
| Turnout | 48.58% |
|---|
| |
 County results
Rutherford: 40–50% 50–60% 60–70% 70–80% 80–90%
Kelly: 40–50% 50–60% 60–70% |
|
Incumbent Treasurer Alexi Giannoulias, a Democrat, did not seek reelection to a second term, instead opting to run for United States Senate. Republican Dan Rutherford was elected to succeed him. As of 2022[update], this is the last time a Republican was elected Illinois state treasurer.
Democratic primary
Treasurer Democratic primary[3] | Party | Candidate | Votes | % |
| | Democratic | Robin Kelly | 472,494 | 57.92 |
| | Democratic | Justin P. Oberman | 343,307 | 42.08 |
| Total votes | 815,801 | 100 |
Republican primary
Treasurer Republican primary[3] | Party | Candidate | Votes | % |
| | Republican | Dan Rutherford | 654,517 | 100 |
| Total votes | 654,517 | 100 |
Green primary
Treasurer Green primary[3] | Party | Candidate | Votes | % |
| | Green | Scott K. Summers | 4,918 | 100 |
| Total votes | 4,918 | 100 |
General election
Treasurer election | Party | Candidate | Votes | % |
| | Republican | Dan Rutherford | 1,811,293 | 49.68 |
| | Democratic | Robin Kelly | 1,650,244 | 45.26 |
| | Green | Scott K. Summers | 115,772 | 3.18 |
| | Libertarian | James Pauly | 68,803 | 1.89 |
| Total votes | 3,646,112 | 100 |
State senate
One-third of the seats of the Illinois Senate were up for election in 2010.
State House of Representatives
All of the seats in the Illinois House of Representatives were up for election in 2010.
- Illinois House of Representatives elections, 2010 at Ballotpedia
Judicial elections
Multiple judicial positions were up for election in 2010.
Ballot measure
One measure, the Governor recall amendment, was certified for the 2010 statewide election.[4]
Illinois Governor Recall Amendment
Voters approved the Illinois Governor Recall Amendment, allowing voters to hold recall elections of Illinois Governors.[5] In order to be approved, the measure required either 60% support among those specifically voting on the amendment or 50% support among all ballots cast in the elections.[6] The 60% support threshold was exceeded.[5][6]
| Illinois Governor Recall Amendment[2][5][6] |
| Option | Votes | % of votes
on measure | % of all ballots
cast |
| For | 1,639,158 | 65.90 | 43.36 |
| Against | 846,966 | 34.10 | 22.40 |
| Total votes | 2,486,124 | 100 | 65.76 |
| Voter turnout | 33.12% |
Local elections
Local elections were held. These included county elections, such as the Cook County elections.
Notes
References
- ^ a b "Voter Turnout". www.elections.il.gov. Illinois State Board of Elections. Retrieved March 22, 2020.
- ^ a b c "Voter Turnout". www.elections.il.gov. Illinois State Board of Elections. Retrieved March 22, 2020.[permanent dead link]
- ^ a b c d e f g h i j k l m n o p "Election Results". www.elections.il.gov. Illinois State Board of Elections. Archived from the original on February 22, 2020. Retrieved March 23, 2020.
- ^ Full Text of HJRCA0031, Illinois General Assembly
- ^ a b c "Illinois Governor Recall Amendment (2010)". Ballotpedia.
- ^ a b c "Illinois Constitution - Amendments Proposed". www.ilga.gov. Illinois General Assembly. Retrieved March 26, 2020.
- General Election 2010: Offices and Candidates from the Illinois State Board of Elections
External links
- Finance
- 2010 House and Senate Campaign Finance for Illinois at the Federal Election Commission
- Illinois Congressional Races in 2010 campaign finance data from OpenSecrets
- Illinois 2010 campaign finance data from Follow the Money
- Media
|
|---|
U.S.
Senate | |
|---|
U.S.
House
(election
ratings) | |
|---|
| Governors | |
|---|
Attorneys
general | |
|---|
State
legislatures | |
|---|
| Mayors | - Anaheim, CA
- Honolulu, HI (special)
- Irvine, CA
- Long Beach, CA
- Louisville, KY
- New Orleans, LA
- Newark, NJ
- Norfolk, VI
- Oakland, CA
- Orange County, FL
- Providence, RI
- San Jose, CA
- Santa Ana, CA
- Tallahassee, TN
- Washington, DC
|
|---|
| States | |
|---|


