2011 South Oxfordshire District Council election |
| | | | | | Party | Conservative | Liberal Democrats | Labour | | Popular vote | 24,253 | 8,807 | 7,567 | | Percentage | 46.1% | 16.7% | 14.6% |
| | | | | | Party | Independent | Henley Residents | | Popular vote | 7,523 | 1,849 | | Percentage | 13.8% | 3.5% | |
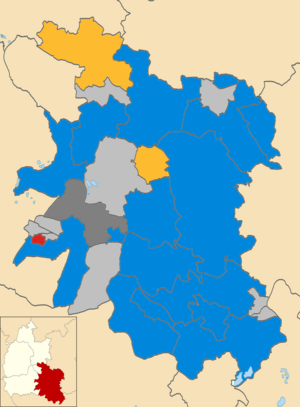 Wards of South Oxfordshire District Council |
The 2011 South Oxfordshire District Council election was held on 5 May 2011 to elect members of South Oxfordshire District Council in England. This was on the same day as other local elections.[1]
Elections were held for all 48 seats on the council. The Conservative Party won 33 seats. The Liberal Democrats won seven seats and Henley Residents Group won two. The Labour Party won one seat and two independent candidates each won a seat. The Conservative Party kept overall control of the council, with its majority reduced to 27.
Summary of results
South Oxfordshire District Council elections result 2011[2] | Party | Seats | Gains | Losses | Net gain/loss | Seats % | Votes % | Votes | +/− |
| | Conservative | 33 | +3 | -8 | -5 | 68,75 | 46.1 | 24,253 | - |
| | Liberal Democrats | 4 | +1 | -3 | -2 | 8.33 | 16.7 | 8,807 | - |
| | Labour | 4 | 3 | 0 | +3 | 8.33 | 14.6 | 7,567 | + |
| | Independent | 5 | 3 | 0 | +3 | 10.42 | 13.8 | 7,253 | + |
| | Henley Residents | 2 | 1 | 0 | +1 | 4.17 | 3.5 | 1,849 | + |
| | Green | 0 | 0 | 0 | 0 | 0 | 4.8 | 2,522 | |
| | UKIP | 0 | 0 | 0 | 0 | 0 | 0.5 | 242 | |
The Conservative Party's share of votes fell from 50.9% in the 2007 South Oxfordshire District Council election[3] to 46.1% in 2011.[2] In 2011 Conservative candidates won three seats from Liberal Democrats. However, Conservative candidates also lost three seats to independent candidates, three to Labour, one to the Henley Residents Group and one to a Liberal Democrat. The Conservatives had won 38 seats in 2007[3] but were reduced to 33 in 2011. However, this was still almost 69% of the 48 seats on the council, and gave the Conservative group an overall majority of 15.
The Liberal Democrats' share of votes fell from 28.6%[3] in 2007 to 16.7% in 2011.[2] The net result of their gaining seats from and losing seats to the Conservatives reduced their number of members on the council to four. However, the Liberal Democrats retained the second largest share of total votes in the district.
The Labour Party increased its share of votes from 7.3% in 2007[3] to 14.6% in 2011.[2] Gaining three seats from the Conservatives increased its number of members on the council to four.
In 2007 two independent candidates were elected to the district council.[3] In 2011 both of these independent councillors were re-elected and three gained seats from Conservatives, increasing the number of independent councillors to five.[2]
In 2007 one Henley Residents Group councillor was elected.[3] In 2011 HRG held that seat and won a second, increasing its number of members on the council to two.[2] HRG won an average of 37.2% of votes in the two wards that it contested.
In 2007 there were Green Party candidates in eight of the district's 29 wards.[3] In 2011 there were only four Green Party candidates in four wards. They won an average of 16.64% of votes in the wards that they contested, and 3.43% of total votes cast in South Oxfordshire District, but no seats.[2]
There was one UK Independence Party candidate, who contested a ward in Didcot. He won 8.6% of the votes in that ward, and was not elected.[2]
Ward results
Aston Rowant
Aston Rowant 2011[4] | Party | Candidate | Votes | % | ±% |
| | Conservative | Dorothy Brown | 793 | 78.2 | |
| | Liberal Democrats | David Stanley Mancey | 221 | 21.8 | |
| Turnout | | | |
| Majority | 572 | | |
| | Conservative hold | Swing | | |
Benson
Benson 2011[4] | Party | Candidate | Votes | % | ±% |
| | Conservative | Felix Bloomfield | 1,053 | | |
| | Conservative | Rachel Elizabeth Ruth Wallis | 857 | | |
| | Liberal Democrats | Sue Cooper | 795 | | |
| | Liberal Democrats | George Francis Daniel Levy | 336 | | |
| | Green | Andrea Jane Powell | 275 | | |
| | Labour | Adam Wood | 266 | | |
| Turnout | | | |
| Majority | 62 | | |
Berinsfield
Berinsfield 2011[4] | Party | Candidate | Votes | % | ±% |
| | Conservative | Phil Cross | 954 | | |
| | Independent | Marc Geoffrey Hiles | 790 | | |
| | Conservative | Richard James Huntley | 786 | | |
| | Green | Mark Christopher Stevenson | 729 | | |
| Turnout | | | |
| Majority | 4 | | |
Brightwell
Brightwell 2011[4] | Party | Candidate | Votes | % | ±% |
| | Independent | Celia Jane Collett | 681 | 64.1 | |
| | Conservative | Mark Hanson | 300 | 28.2 | |
| | Labour | Liz Neighbour | 81 | 7.6 | |
| Turnout | | | |
| Majority | 381 | | |
| | Independent hold | Swing | | |
Chalgrove
Chalgrove 2011[4] | Party | Candidate | Votes | % | ±% |
| | Liberal Democrats | David Graham Turner | 729 | 61.6 | |
| | Conservative | Carol Fowler | 375 | 31.7 | |
| | Labour | Paul David Collins | 80 | 6.8 | |
| Turnout | | | |
| Majority | 354 | | |
| | Liberal Democrats hold | Swing | | |
Chiltern Woods
Chiltern Woods 2011[4] | Party | Candidate | Votes | % | ±% |
| | Conservative | Judith Mary Nimmo-Smith | 715 | 73.9 | |
| | Liberal Democrats | Andrew Stephen Davies | 141 | 14.6 | |
| | Labour | Veronica Treacher | 112 | 11.6 | |
| Turnout | | | |
| Majority | 574 | | |
| | Conservative hold | Swing | | |
Chinnor
Chinnor 2011[4] | Party | Candidate | Votes | % | ±% |
| | Conservative | Christopher Allen Hood | 1,054 | | |
| | Conservative | Geoff Andrews | 1,026 | | |
| | Independent | Pat Haywood | 740 | | |
| | Independent | Martin George Wright | 737 | | |
| | Labour | Simon Stone | 327 | | |
| Turnout | | | |
| Majority | 286 | | |
| | Conservative hold | Swing | | |
Cholsey and Wallingford South
Cholsey and Wallingford South 2011[4] | Party | Candidate | Votes | % | ±% |
| | Independent | Mark Stuart Gray | 1,229 | | |
| | Conservative | Pat Dawe | 883 | | |
| | Conservative | Felicity Ann Aska | 838 | | |
| | Labour | Mandy Winters | 459 | | |
| | Labour | John Charles Moody | 229 | | |
| Turnout | | | |
| Majority | 391 | | |
| | Conservative hold | Swing | | |
Crowmarsh
Crowmarsh 2011[4] | Party | Candidate | Votes | % | ±% |
| | Conservative | Kristina Elizabeth Crabbe | 510 | 55.4 | |
| | Liberal Democrats | John Howard Griffin | 403 | 44.6 | |
| Turnout | | | |
| Majority | 98 | | |
| | Conservative hold | Swing | | |
Didcot All Saints
Didcot All Saints 2011[4] | Party | Candidate | Votes | % | ±% |
| | Labour | Terry Joslin | 647 | | |
| | Conservative | Margaret Ann Turner | 642 | | |
| | Conservative | Jane Murphy | 635 | | |
| | Labour | Nick Hards | 597 | | |
| | Liberal Democrats | Andrew Peter Jones | 226 | | |
| | Liberal Democrats | James Robert Loder | 185 | | |
| Turnout | | | |
| Majority | 45 | | |
Didcot Ladygrove
Didcot Ladygrove 2011[4] | Party | Candidate | Votes | % | ±% |
| | Conservative | Tony Richard John Harbour | 1,106 | | |
| | Conservative | Bill Service | 1,060 | | |
| | Independent | Neville Frank Harris | 948 | | |
| | Conservative | Roger Mark Hawlor | 903 | | |
| | Labour | Bill Atkinson | 529 | | |
| | Labour | Nicola Jane Williams | 506 | | |
| | Labour | Robert Allen Bulman | 408 | | |
| | UKIP | Paul John Williams | 242 | | |
| Turnout | | | |
| Majority | 45 | | |
Didcot Northbourne
Didcot Northbourne 2011[4] | Party | Candidate | Votes | % | ±% |
| | Labour | Bernard Douglas Cooper | 504 | | |
| | Conservative | Steve Connell | 458 | | |
| | Labour | Scott Robert Wilgrove | 442 | | |
| | Liberal Democrats | David Rouane | 429 | | |
| | Conservative | Phil Hayward | 428 | | |
| | Independent | Sue Such | 348 | | |
| Turnout | | | |
| Majority | 16 | | |
Didcot Park
Didcot Park 2011[4] | Party | Candidate | Votes | % | ±% |
| | Labour | Margaret Lesley Davies | 769 | | |
| | Labour | Eleanor Hards | 730 | | |
| | Conservative | Christopher Edwin Harrison | 668 | | |
| | Conservative | Alan Roy Thompson | 640 | | |
| | Liberal Democrats | Jen Parry | 253 | | |
| | Liberal Democrats | Tony Worgan | 180 | | |
| Turnout | | | |
| Majority | 62 | | |
| | Labour hold | Swing | | |
Forest Hill and Holton
Forest Hill and Holton 2011[4] | Party | Candidate | Votes | % | ±% |
| | Liberal Democrats | Anne Purse | 621 | 61.5 | |
| | Conservative | Ginette Camps-Walsh | 389 | 38.5 | |
| Turnout | | | |
| Majority | 232 | | |
| | Liberal Democrats hold | Swing | | |
Garsington
Garsington 2011[4] | Party | Candidate | Votes | % | ±% |
| | Conservative | Elizabeth Gillespie | 639 | 65.9 | |
| | Liberal Democrats | Jane Jackson | 331 | 34.1 | |
| Turnout | | | |
| Majority | 308 | | |
| | Conservative hold | Swing | | |
Goring
Goring 2011[4] | Party | Candidate | Votes | % | ±% |
| | Conservative | Ann Ducker | 1,447 | | |
| | Conservative | Pearl Slatter | 1,199 | | |
| | Green | Peter Hugh Dragonetti | 866 | | |
| | Liberal Democrats | Caroline Shirley Wardle | 551 | | |
| | Labour | Fran Barefield | 394 | | |
| Turnout | | | |
| Majority | 333 | | |
| | Conservative hold | Swing | | |
Great Milton
Great Milton 2011[4] | Party | Candidate | Votes | % | ±% |
| | Conservative | Stephen Harrod | 641 | 60.3 | |
| | Liberal Democrats | Wendy Court | 422 | 39.7 | |
| Turnout | | | |
| Majority | 219 | | |
| | Conservative gain from Liberal Democrats |
Hagbourne
Hagbourne 2011[4] | Party | Candidate | Votes | % | ±% |
| | Conservative | Leo Docherty | 831 | 73.7 | |
| | Labour | Alison Lane | 296 | 26.3 | |
| Turnout | | | |
| Majority | 535 | | |
| | Conservative hold | Swing | | |
Henley North
Henley North 2011[4] | Party | Candidate | Votes | % | ±% |
| | Henley Residents | Elizabeth Hodgkin | 923 | | |
| | Conservative | Joan Bland | 801 | | |
| | Conservative | Lorraine Hillier | 789 | | |
| | Henley Residents | Martin Sydney Akehurst | 696 | | |
| | Liberal Democrats | Julian Philip Allison | 139 | | |
| | Liberal Democrats | Neill James Robert Hendry | 123 | | |
| | Labour | Paul Holland | 116 | | |
| Turnout | | | |
| Majority | 93 | | |
Henley South
Henley South 2011[4] | Party | Candidate | Votes | % | ±% |
| | Henley Residents | Jennifer Wood | 926 | | |
| | Conservative | William Arthur Henry Hall | 723 | | |
| | Independent | Ken Arlett | 710 | | |
| | Conservative | David Michael Silvester | 670 | | |
| | Liberal Democrats | Asbjorg Dunker | 274 | | |
| | Liberal Democrats | Barry George Wood | 253 | | |
| | Labour | Margaret Goodwin | 208 | | |
| Turnout | | | |
| Majority | 13 | | |
Sandford
Sandford 2011[4] | Party | Candidate | Votes | % | ±% |
| | Conservative | John Anthony Cotton | 424 | 47.7 | |
| | Independent | John Ernest Stimson | 248 | 27.9 | |
| | Labour | Will Atkinson | 216 | 24.3 | |
| Turnout | | | |
| Majority | 176 | | |
| | Conservative hold | Swing | | |
Shiplake
Shiplake 2011[4] | Party | Candidate | Votes | % | ±% |
| | Conservative | Malcolm Leonard | 1,371 | | |
| | Conservative | Rob Simister | 1,176 | | |
| | Liberal Democrats | Peter Wardle | 345 | | |
| | Labour | Janet Matthews | 321 | | |
| Turnout | | | |
| Majority | 2,202 | | |
| | Conservative hold | Swing | | |
Sonning Common
Sonning Common 2011[4] | Party | Candidate | Votes | % | ±% |
| | Conservative | Paul Harrison | 1,461 | | |
| | Conservative | Alan Geoffrey Rooke | 1,259 | | |
| | Green | Aidan Lawrence Carlisle | 652 | | |
| | Labour | David Winchester | 486 | | |
| Turnout | | | |
| Majority | 607 | | |
| | Conservative hold | Swing | | |
Thame North
Thame North 2011[4] | Party | Candidate | Votes | % | ±% |
| | Conservative | Mike Welply | 1,075 | | |
| | Liberal Democrats | David William Bretherton | 898 | | |
| | Liberal Democrats | Jeanette Ann Matelot Green | 800 | | |
| Turnout | | | |
| Majority | 277 | | |
Thame South
Thame South 2011[4] | Party | Candidate | Votes | % | ±% |
| | Conservative | David William Dodds | 1,065 | | |
| | Independent | Ann Midwinter | 916 | | |
| | Labour | Mary Honora Stiles | 892 | | |
| | Liberal Democrats | David Arthur Laver | 422 | | |
| | Liberal Democrats | Pete Barker | 313 | | |
| Turnout | | | |
| Majority | 24 | | |
Wallingford North
Wallingford North 2011[4] | Party | Candidate | Votes | % | ±% |
| | Conservative | Marcus David Harris | 854 | | |
| | Conservative | Imran Lokhon | 810 | | |
| | Independent | Charles Brinley Ledlie | 643 | | |
| | Labour | George William Kneeshaw | 493 | | |
| | Labour | Graham Ruecroft | 406 | | |
| Turnout | | | |
| Majority | 167 | | |
| | Conservative hold | Swing | | |
Watlington
Watlington 2011[4] | Party | Candidate | Votes | % | ±% |
| | Conservative | Anna Fairbairn Badcock | 1,351 | | |
| | Conservative | Angie Paterson | 1,328 | | |
| | Liberal Democrats | Nick Hancock | 536 | | |
| | Labour | James Herbert Merritt | 366 | | |
| Turnout | | | |
| Majority | 792 | | |
| | Conservative hold | Swing | | |
Wheatley
Wheatley 2011[4] | Party | Candidate | Votes | % | ±% |
| | Conservative | Janet Maureen Carr | 976 | | |
| | Liberal Democrats | Roger Thomas Bell | 786 | | |
| | Conservative | John Patrick Walsh | 724 | | |
| | Liberal Democrats | Helena Tess Harris | 694 | | |
| Turnout | | | |
| Majority | 42 | | |
Woodcote
Woodcote 2011[4] | Party | Candidate | Votes | % | ±% |
| | Conservative | Christopher John Quinton | 703 | 63.8 | |
| | Liberal Democrats | Robin Heys Pierce | 304 | 27.6 | |
| | Labour | Amanda Holland | 95 | 8.6 | |
| Turnout | | | |
| Majority | 399 | | |
| | Conservative gain from Liberal Democrats |
References
- ^ "England council elections". BBC Online. 10 May 2011. Retrieved 30 May 2018.
- ^ a b c d e f g h Teale, Andrew. "South Oxfordshire". Local Election Results 2011. Retrieved 30 May 2018.
- ^ a b c d e f g Teale, Andrew. "South Oxfordshire". Local Election Results 2007. Retrieved 30 May 2018.
- ^ a b c d e f g h i j k l m n o p q r s t u v w x y z aa ab ac "2011 District Council Election Results" (PDF). South Oxfordshire District Council. Retrieved 30 May 2018.


