Cuenca, Batangas
Municipality in Batangas, Philippines
Municipality in Calabarzon, Philippines

Seal
Home of Bakers

Map of Batangas with Cuenca highlighted
Members
- Niña Neila P. Verdan
- Ronnel D. Pasia
- Ervin Raymund L. Remo
- Angelica Joy D. Guce
- Anacleto A. Javier
- Danilo L. Magsombol
- Henry A. Larcia
- Marcelino A. Malibiran
(2020 census)[3]
11.65
4222
041009000
Cuenca, officially the Municipality of Cuenca (Tagalog: Bayan ng Cuenca), is a 4th class municipality in the province of Batangas, Philippines. According to the 2020 census, it has a population of 36,235 people.[3]
History
Once a part of San Jose, it became an independent town under the name "Cuenca" in 1876, after the Spanish hometown of the then-Governor of Batangas that resembles its cold breeze and beautiful scenic spots.[5] Its main tourist attraction is the 700-meter-high (2,300 ft) mountain, Mount Macolod (Mount Maculot).
The Patron of Cuenca is Saint Isidore the Laborer, the patron of farmers. A celebratory feast is held annually every May 15.
Geography
According to the Philippine Statistics Authority, the municipality has a land area of 58.18 square kilometers (22.46 sq mi) [6] constituting 1.86% of the 3,119.75-square-kilometer (1,204.54 sq mi) total area of Batangas.
Barangays
Cuenca is politically subdivided into 21 barangays.[7] Each barangay consists of puroks and some have sitios.
| PSGC | Barangay | Population | ±% p.a. | |||
|---|---|---|---|---|---|---|
| 2020[3] | 2010[8] | |||||
| 041009001 | Balagbag | 2.3% | 848 | 778 | ▴ | 0.87% |
| 041009002 | Bungahan | 5.6% | 2,032 | 1,830 | ▴ | 1.05% |
| 041009003 | Calumayin | 0.9% | 326 | 354 | ▾ | −0.82% |
| 041009005 | Dalipit East | 1.7% | 609 | 591 | ▴ | 0.30% |
| 041009006 | Dalipit West | 1.6% | 593 | 533 | ▴ | 1.07% |
| 041009007 | Dita | 12.6% | 4,579 | 4,392 | ▴ | 0.42% |
| 041009008 | Don Juan | 2.4% | 885 | 783 | ▴ | 1.23% |
| 041009009 | Emmanuel | 5.5% | 1,985 | 2,011 | ▾ | −0.13% |
| 041009010 | Ibabao | 9.2% | 3,343 | 3,188 | ▴ | 0.48% |
| 041009011 | Labac | 5.6% | 2,037 | 2,096 | ▾ | −0.29% |
| 041009012 | Pinagkaisahan | 5.5% | 1,978 | 1,875 | ▴ | 0.54% |
| 041009013 | San Felipe | 9.3% | 3,377 | 3,171 | ▴ | 0.63% |
| 041009014 | San Isidro | 5.8% | 2,091 | 1,804 | ▴ | 1.49% |
| 041009015 | Barangay 1 (Poblacion) | 5.2% | 1,883 | 1,639 | ▴ | 1.40% |
| 041009016 | Barangay 2 (Poblacion) | 0.7% | 263 | 376 | ▾ | −3.51% |
| 041009017 | Barangay 3 (Poblacion) | 2.0% | 735 | 680 | ▴ | 0.78% |
| 041009018 | Barangay 4 (Poblacion) | 2.6% | 930 | 1,022 | ▾ | −0.94% |
| 041009019 | Barangay 5 (Poblacion) | 1.0% | 378 | 438 | ▾ | −1.46% |
| 041009020 | Barangay 6 (Poblacion) | 1.4% | 513 | 499 | ▴ | 0.28% |
| 041009021 | Barangay 7 (Poblacion) | 5.1% | 1,861 | 1,848 | ▴ | 0.07% |
| 041009022 | Barangay 8 (Poblacion) | 4.2% | 1,537 | 1,328 | ▴ | 1.47% |
| Total | 36,235 | 31,236 | ▴ | 1.50% | ||
In 1954, Don Juan was constituted as a barrio from the sitios of Lungos ng Parang, Kulit, Lumampao, Pisa, Napapanayan and Lagundian.[9]
Climate
| Climate data for Cuenca, Batangas | |||||||||||||
|---|---|---|---|---|---|---|---|---|---|---|---|---|---|
| Month | Jan | Feb | Mar | Apr | May | Jun | Jul | Aug | Sep | Oct | Nov | Dec | Year |
| Mean daily maximum °C (°F) | 27 (81) | 28 (82) | 30 (86) | 31 (88) | 30 (86) | 28 (82) | 27 (81) | 27 (81) | 27 (81) | 27 (81) | 27 (81) | 27 (81) | 28 (83) |
| Mean daily minimum °C (°F) | 18 (64) | 18 (64) | 19 (66) | 20 (68) | 22 (72) | 23 (73) | 22 (72) | 22 (72) | 22 (72) | 21 (70) | 20 (68) | 19 (66) | 21 (69) |
| Average precipitation mm (inches) | 11 (0.4) | 13 (0.5) | 14 (0.6) | 32 (1.3) | 101 (4.0) | 142 (5.6) | 208 (8.2) | 187 (7.4) | 175 (6.9) | 131 (5.2) | 68 (2.7) | 39 (1.5) | 1,121 (44.3) |
| Average rainy days | 5.2 | 5.0 | 7.4 | 11.5 | 19.8 | 23.5 | 27.0 | 25.9 | 25.2 | 23.2 | 15.5 | 8.3 | 197.5 |
| Source: Meteoblue (modeled/calculated data, not measured locally)[10] | |||||||||||||
Demographics
| Year | Pop. | ±% p.a. |
|---|---|---|
| 1903 | 5,990 | — |
| 1918 | 7,106 | +1.15% |
| 1939 | 7,838 | +0.47% |
| 1948 | 9,063 | +1.63% |
| 1960 | 11,056 | +1.67% |
| 1970 | 14,538 | +2.77% |
| 1975 | 15,975 | +1.91% |
| 1980 | 17,109 | +1.38% |
| 1990 | 20,176 | +1.66% |
| 1995 | 22,758 | +2.28% |
| 2000 | 25,642 | +2.59% |
| 2007 | 28,581 | +1.51% |
| 2010 | 31,236 | +3.29% |
| 2015 | 32,783 | +0.92% |
| 2020 | 36,235 | +1.99% |
| Source: Philippine Statistics Authority[11][8][12][13] | ||
In the 2020 census, Cuenca had a population of 36,235.[3] The population density was 620 inhabitants per square kilometre (1,600/sq mi).
Economy
Poverty Incidence of Cuenca
Graphs are unavailable due to technical issues. There is more info on Phabricator and on MediaWiki.org. |
Gallery
-
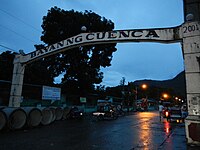 Welcome arch
 -
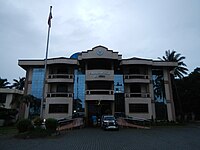 Municipal hall
 -
 Police station
 -
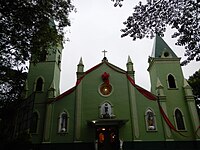 Saint Isidore the Farmer Parish Church
 -
 Street in Cuenca


References
- ^ Municipality of Cuenca | (DILG)
- ^ "2015 Census of Population, Report No. 3 – Population, Land Area, and Population Density" (PDF). Philippine Statistics Authority. Quezon City, Philippines. August 2016. ISSN 0117-1453. Archived (PDF) from the original on May 25, 2021. Retrieved July 16, 2021.
- ^ a b c d Census of Population (2020). "Region IV-A (Calabarzon)". Total Population by Province, City, Municipality and Barangay. Philippine Statistics Authority. Retrieved 8 July 2021.
- ^ "PSA Releases the 2018 Municipal and City Level Poverty Estimates". Philippine Statistics Authority. 15 December 2021. Retrieved 22 January 2022.
- ^ "Executive Summary" (PDF). Commission on Audit. 2015. Retrieved December 21, 2021.
- ^ "Province: Batangas". PSGC Interactive. Quezon City, Philippines: Philippine Statistics Authority. Retrieved 12 November 2016.
- ^ "Municipal: Cuenca, Batangas". PSGC Interactive. Quezon City, Philippines: Philippine Statistics Authority. Retrieved 8 January 2016.
- ^ a b Census of Population and Housing (2010). "Region IV-A (Calabarzon)" (PDF). Total Population by Province, City, Municipality and Barangay. National Statistics Office. Retrieved 29 June 2016.
- ^ "Republic Act No. 1122; An Act to Create the Barrio of Don Juan in the Municipality of Cuenca, Province of Batangas". PhilippineLaw.info. Archived from the original on 23 May 2012. Retrieved 19 January 2021.
- ^ "Cuenca: Average Temperatures and Rainfall". Meteoblue. Retrieved 5 May 2020.
- ^ Census of Population (2015). "Region IV-A (Calabarzon)". Total Population by Province, City, Municipality and Barangay. Philippine Statistics Authority. Retrieved 20 June 2016.
- ^ Censuses of Population (1903–2007). "Region IV-A (Calabarzon)". Table 1. Population Enumerated in Various Censuses by Province/Highly Urbanized City: 1903 to 2007. National Statistics Office.
{{cite encyclopedia}}: CS1 maint: numeric names: authors list (link) - ^ "Province of Batangas". Municipality Population Data. Local Water Utilities Administration Research Division. Retrieved 17 December 2016.
- ^ "Poverty incidence (PI):". Philippine Statistics Authority. Retrieved December 28, 2020.
- ^ "Estimation of Local Poverty in the Philippines" (PDF). Philippine Statistics Authority. 29 November 2005.
- ^ "2003 City and Municipal Level Poverty Estimates" (PDF). Philippine Statistics Authority. 23 March 2009.
- ^ "City and Municipal Level Poverty Estimates; 2006 and 2009" (PDF). Philippine Statistics Authority. 3 August 2012.
- ^ "2012 Municipal and City Level Poverty Estimates" (PDF). Philippine Statistics Authority. 31 May 2016.
- ^ "Municipal and City Level Small Area Poverty Estimates; 2009, 2012 and 2015". Philippine Statistics Authority. 10 July 2019.
- ^ "PSA Releases the 2018 Municipal and City Level Poverty Estimates". Philippine Statistics Authority. 15 December 2021. Retrieved 22 January 2022.
External links
 Media related to Cuenca, Batangas at Wikimedia Commons
- Philippine Standard Geographic Code


