Calaveras County, California
County in California, United States
County in California, United States

Flag

Seal

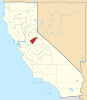
Interactive map of Calaveras County

Location in the state of California
Mountain Ranch (area)
Supervisors
- Gary Tofanelli
- Jack Garamendi
- Martin Huberty
- Amanda Folendorf
- Benjamin Stopper
(2020)
Calaveras County (/ˌkæləˈvɛrəs/ ⓘ), officially the County of Calaveras, is a county in both the Gold Country and High Sierra regions of the U.S. state of California. As of the 2020 census, the population was 45,292.[5] The county seat is San Andreas.[6] Angels Camp is the county's only incorporated city. Calaveras is Spanish for "skulls"; the county was reportedly named for the remains of Native Americans discovered by the Spanish explorer Captain Gabriel Moraga.
Calaveras Big Trees State Park, a preserve of giant sequoia trees, is in the county several miles east of the town of Arnold on State Highway 4. Credit for the discovery of giant sequoias there is given to Augustus T. Dowd, a trapper who made the discovery in 1852 while tracking a bear. When the bark from the "Discovery Tree" was removed and taken on tour around the world, the trees became a worldwide sensation and one of the county's first tourist attractions. The uncommon gold telluride mineral calaverite was discovered in the county in 1861 and is named for it.
Mark Twain set his story "The Celebrated Jumping Frog of Calaveras County" in the county. The county hosts an annual fair and Jumping Frog Jubilee, featuring a frog-jumping contest, to celebrate the association with Twain's story. Each year's winner is commemorated with a brass plaque mounted in the sidewalk of downtown Historic Angels Camp and this feature is known as the Frog Hop of Fame.
In 2015, Calaveras County had the highest rate of suicide deaths in the United States, with 49.1 per 100,000 people.[7]
Etymology
The Spanish word calaveras means "skulls." The county takes its name from the Calaveras River; it was said to have been named by Spanish explorer Gabriel Moraga, during his 1806–1808 expeditions, when he found many skulls of Native Americans along the banks of the stream. He believed they had either died of famine or been killed in tribal conflicts over hunting and fishing grounds. A more likely cause was a European epidemic disease, acquired from interacting with other tribes near the Missions on the coast. The Stanislaus River, which forms the southern boundary, is named for Estanislao, a Lakisamni Yokuts who escaped from Mission San Jose in the late 1830s. He is reported to have raised a small group of men with crude weapons, hiding in the foothills when the Mexicans attacked. The natives were quickly decimated by Mexican firearms.
In 1836, John Marsh, Jose Noriega, and a party of men went exploring in Northern California. They made camp along a river bed in the evening, and upon waking discovered that they had camped amid a great quantity of skulls and bones. They also gave the river the name Calaveras.[8][9][10]
Twain spent 88 days in the county in 1865, during which he heard the story that became "The Celebrated Jumping Frog of Calaveras County" at the Angel Hotel. This story kicked off his career and put Calaveras County on the map.[11]
History
Calaveras County was one of the original counties of the state of California, created in 1850 at the time of admission to the Union. Parts of the county's territory were reassigned to Amador County in 1854 and to Alpine County in 1864.[1]
The county's geography includes landmarks, rolling hills, and giant valleys. It is also known for its friendly communities, and businesses such as agriculture management and construction engineering. It has numerous caverns, such as Mercer Caverns, California Cavern and Moaning Cavern that are national destinations for tourists from across the country. Other attractions include a thriving wine making industry, including the largest of the Calaveras wineries: Ironstone Vineyards, mountain sports recreation and the performing arts.
Gold prospecting in Calaveras County began in late 1848 with a camp founded by Henry Angel. Angel may have first arrived in California as a soldier, serving under Colonel Frémont during the Mexican War. After the war's end, he found himself in Monterey where he heard of the fabulous finds in the gold fields. He joined the Carson-Robinson party of prospectors and set out for the mines. The company parted ways upon reaching what later became known as Angels Creek. Henry Angel tried placer mining but soon opened a trading post. By the end of the year, over one hundred tents were scattered about the creek and the settlement was referred to as Angels Trading Post, later shortened to Angels Camp.
Placer mining soon gave out around the camp, but an extensive gold-bearing quartz vein of the area's Mother Lode was located by the Winter brothers during the mid-1850s, and this brought in the foundations of a permanent town. This vein followed Main Street from Angels Creek up to the southern edge of Altaville. Five major mines worked the rich vein: the Stickle, the Utica, the Lightner, the Angels, and the Sultana. These mines reached their peaks during the 1880s and 1890s, when over 200 stamp mills crushed quartz ore brought in by hand cars on track from the mines. By the time hard rock mining was done, the five mines had producing a total of over $20 million in gold.[12]
The telluride mineral calaverite was first recognized and obtained in 1861 from the Stanislaus Mine, Carson Hill, Angels Camp, in Calaveras Co., California.[13] It was named for the County of origin by chemist and mineralogist Frederick Augustus Genth who differentiated it from the known gold telluride mineral sylvanite, and formally reported it as a new gold mineral in 1868.[14][15]
Geography

According to the U.S. Census Bureau, the county has a total area of 1,037 square miles (2,690 km2), of which 1,020 square miles (2,600 km2) is land and 17 square miles (44 km2) (1.6%) is water.[16] A California Department of Forestry report lists the county's area in acres as 663,000, although the exact figure would be 663,477.949 acres (2,685.00000 km2). There are a number of caverns located in Calaveras County.
Adjacent counties
- Amador County – north
- Alpine County – northeast
- Tuolumne County – south
- Stanislaus County – southwest
- San Joaquin County – west
National protected area
- Stanislaus National Forest (part)
Demographics
| Census | Pop. | Note | %± |
|---|---|---|---|
| 1850 | 16,884 | — | |
| 1860 | 16,299 | −3.5% | |
| 1870 | 8,895 | −45.4% | |
| 1880 | 9,094 | 2.2% | |
| 1890 | 8,882 | −2.3% | |
| 1900 | 11,200 | 26.1% | |
| 1910 | 9,171 | −18.1% | |
| 1920 | 6,183 | −32.6% | |
| 1930 | 6,008 | −2.8% | |
| 1940 | 8,221 | 36.8% | |
| 1950 | 9,902 | 20.4% | |
| 1960 | 10,289 | 3.9% | |
| 1970 | 13,585 | 32.0% | |
| 1980 | 20,710 | 52.4% | |
| 1990 | 31,998 | 54.5% | |
| 2000 | 40,554 | 26.7% | |
| 2010 | 45,578 | 12.4% | |
| 2020 | 45,292 | −0.6% | |
| 2023 (est.) | 46,565 | [17] | 2.8% |
| U.S. Decennial Census[18] 1790–1960[19] 1900–1990[20] 1990–2000[21] 2010[22] 2020[23] | |||
2020 census
| Race / Ethnicity | Pop 2010[22] | Pop 2020[23] | % 2010 | % 2020 |
|---|---|---|---|---|
| White alone (NH) | 38,074 | 34,668 | 83.54% | 76.54% |
| Black or African American alone (NH) | 355 | 334 | 0.78% | 0.74% |
| Native American or Alaska Native alone (NH) | 526 | 497 | 1.15% | 1.10% |
| Asian alone (NH) | 529 | 706 | 1.16% | 1.56% |
| Pacific Islander alone (NH) | 71 | 75 | 0.16% | 0.17% |
| Some Other Race alone (NH) | 68 | 268 | 0.15% | 0.59% |
| Mixed Race/Multi-Racial (NH) | 1,252 | 2,879 | 2.75% | 6.36% |
| Hispanic or Latino (any race) | 4,703 | 5,865 | 10.32% | 12.95% |
| Total | 45,578 | 45,292 | 100.00% | 100.00% |
Note: the US Census treats Hispanic/Latino as an ethnic category. This table excludes Latinos from the racial categories and assigns them to a separate category. Hispanics/Latinos can be of any race.
2011
| Population, race, and income | |||||
|---|---|---|---|---|---|
| Total population[24] | 45,794 | ||||
| White[24] | 41,672 | 91.0% | |||
| Black or African American[24] | 496 | 1.1% | |||
| American Indian or Alaska Native[24] | 571 | 1.2% | |||
| Asian[24] | 601 | 1.3% | |||
| Native Hawaiian or other Pacific Islander[24] | 16 | 0.0% | |||
| of other race[24] | 1,114 | 2.4% | |||
| Two or more races[24] | 1,324 | 2.9% | |||
| Hispanic or Latino (of any race)[25] | 4,688 | 10.2% | |||
| Per capita income[26] | $28,667 | ||||
| Median household income[27] | $55,256 | ||||
| Median family income[28] | $67,253 | ||||
Places by population, race, and income
| Places by population and race | ||||||||
|---|---|---|---|---|---|---|---|---|
| Place | Type[29] | Population[24] | White[24] | Other[24] [note 1] | Asian[24] | Black or African American[24] | Native American[24] [note 2] | Hispanic or Latino (of any race)[25] |
| Angels | City | 3,820 | 94.9% | 5.1% | 0.0% | 0.0% | 0.0% | 17.7% |
| Arnold | CDP | 3,172 | 93.0% | 6.7% | 0.0% | 0.0% | 0.3% | 6.9% |
| Avery | CDP | 415 | 100.0% | 0.0% | 0.0% | 0.0% | 0.0% | 0.0% |
| Copperopolis | CDP | 4,177 | 93.0% | 3.4% | 0.7% | 2.9% | 0.0% | 3.6% |
| Dorrington | CDP | 466 | 88.4% | 11.6% | 0.0% | 0.0% | 0.0% | 16.7% |
| Forest Meadows | CDP | 1,546 | 100.0% | 0.0% | 0.0% | 0.0% | 0.0% | 0.0% |
| Mokelumne Hill | CDP | 717 | 94.8% | 1.5% | 0.0% | 0.0% | 3.6% | 11.2% |
| Mountain Ranch | CDP | 1,541 | 93.3% | 0.9% | 0.0% | 5.8% | 0.0% | 5.9% |
| Murphys | CDP | 1,965 | 92.6% | 3.7% | 2.5% | 0.0% | 1.2% | 5.6% |
| Rail Road Flat | CDP | 410 | 82.2% | 0.0% | 0.0% | 17.8% | 0.0% | 8.3% |
| Rancho Calaveras | CDP | 5,997 | 88.8% | 8.9% | 0.4% | 0.3% | 1.6% | 12.2% |
| San Andreas | CDP | 2,941 | 92.0% | 5.4% | 0.5% | 1.3% | 0.8% | 16.1% |
| Vallecito | CDP | 841 | 100.0% | 0.0% | 0.0% | 0.0% | 0.0% | 3.6% |
| Valley Springs | CDP | 4,196 | 92.3% | 2.8% | 4.9% | 0.0% | 0.0% | 20.8% |
| Wallace | CDP | 131 | 100.0% | 0.0% | 0.0% | 0.0% | 0.0% | 0.0% |
| West Point | CDP | 654 | 95.3% | 4.7% | 0.0% | 0.0% | 0.0% | 1.2% |
| Places by population and income | |||||
|---|---|---|---|---|---|
| Place | Type[29] | Population[30] | Per capita income[26] | Median household income[27] | Median family income[28] |
| Angels | City | 3,820 | $28,279 | $48,614 | $65,625 |
| Arnold | CDP | 3,172 | $32,814 | $53,036 | $54,296 |
| Avery | CDP | 415 | $15,683 | $23,162 | $28,750 |
| Copperopolis | CDP | 4,177 | $27,834 | $62,798 | $71,715 |
| Dorrington | CDP | 466 | $32,069 | $39,677 | $39,435 |
| Forest Meadows | CDP | 1,546 | $37,177 | $81,950 | $84,212 |
| Mokelumne Hill | CDP | 717 | $28,816 | $68,622 | $77,000 |
| Mountain Ranch | CDP | 1,541 | $30,141 | $46,444 | $61,224 |
| Murphys | CDP | 1,965 | $30,462 | $43,885 | $52,330 |
| Rail Road Flat | CDP | 410 | $24,343 | $35,882 | $36,618 |
| Rancho Calaveras | CDP | 5,997 | $27,578 | $72,623 | $77,528 |
| San Andreas | CDP | 2,941 | $20,835 | $37,657 | $65,096 |
| Vallecito | CDP | 841 | $27,786 | $78,209 | $79,459 |
| Valley Springs | CDP | 4,196 | $28,404 | $67,009 | $74,500 |
| Wallace | CDP | 131 | $38,162 | $46,691 | $46,691 |
| West Point | CDP | 654 | $18,043 | $37,997 | $38,516 |
2010 Census
The 2010 United States Census reported that Calaveras County had a population of 45,578. The racial makeup of Calaveras County was 40,522 (88.9%) White, 383 (0.8%) African American, 689 (1.5%) Native American, 571 (1.3%) Asian, 79 (0.2%) Pacific Islander, 1,534 (3.4%) from other races, and 1,800 (3.9%) from two or more races. Hispanic or Latino of any race were 4,703 persons (10.3%).[31]
| Population reported at 2010 United States Census | |||||||||
|---|---|---|---|---|---|---|---|---|---|
The County | Total Population | White | African American | Native American | Asian | Pacific Islander | other races | two or more races | Hispanic or Latino (of any race) |
| Calaveras County | 45,578 | 40,522 | 383 | 689 | 571 | 79 | 1,534 | 1,800 | 4,703 |
Incorporated city | Total Population | White | African American | Native American | Asian | Pacific Islander | other races | two or more races | Hispanic or Latino (of any race) |
| Angels Camp | 3,836 | 3,329 | 12 | 48 | 49 | 5 | 270 | 123 | 498 |
Census-designated places | Total Population | White | African American | Native American | Asian | Pacific Islander | other races | two or more races | Hispanic or Latino (of any race) |
| Arnold | 3,843 | 3,590 | 20 | 28 | 46 | 3 | 60 | 96 | 259 |
| Avery | 646 | 604 | 5 | 7 | 3 | 1 | 2 | 24 | 38 |
| Copperopolis | 3,671 | 3,318 | 31 | 43 | 36 | 12 | 83 | 148 | 454 |
| Dorrington | 609 | 576 | 0 | 2 | 11 | 1 | 1 | 18 | 33 |
| Forest Meadows | 1,249 | 1,198 | 0 | 4 | 14 | 0 | 7 | 26 | 60 |
| Mokelumne Hill | 646 | 571 | 3 | 12 | 4 | 0 | 26 | 30 | 66 |
| Mountain Ranch | 1,628 | 1,472 | 15 | 33 | 18 | 2 | 15 | 73 | 123 |
| Murphys | 2,213 | 2,045 | 9 | 17 | 7 | 10 | 82 | 43 | 223 |
| Rail Road Flat | 475 | 411 | 0 | 15 | 4 | 2 | 9 | 34 | 41 |
| Rancho Calaveras | 5,325 | 4,645 | 48 | 102 | 87 | 13 | 195 | 235 | 670 |
| San Andreas | 2,783 | 2,453 | 23 | 48 | 28 | 1 | 83 | 147 | 255 |
| Vallecito | 442 | 398 | 0 | 6 | 11 | 1 | 5 | 21 | 33 |
| Valley Springs | 3,553 | 3,047 | 35 | 39 | 70 | 6 | 179 | 177 | 454 |
| Wallace | 403 | 347 | 3 | 4 | 10 | 2 | 22 | 15 | 32 |
| West Point | 674 | 563 | 0 | 43 | 2 | 7 | 29 | 30 | 67 |
Other unincorporated areas | Total Population | White | African American | Native American | Asian | Pacific Islander | other races | two or more races | Hispanic or Latino (of any race) |
| All others not CDPs (combined) | 13,582 | 11,955 | 179 | 238 | 171 | 13 | 466 | 560 | 1,397 |
2000
As of the census[32] of 2000, there were 40,554 people, 16,469 households, and 11,742 families residing in the county. The population density was 40 people per square mile (15 people/km2). There were 22,946 housing units at an average density of 22 per square mile (8.5/km2). The racial makeup of the county was 91.2% White, 0.8% Black or African American, 1.7% Native American, 0.9% Asian, 0.1% Pacific Islander, 2.1% from other races, and 3.3% from two or more races. 6.8% of the population were Hispanic or Latino of any race. 15.7% were of German, 13.0% English, 10.7% Irish, 7.4% Italian and 7.0% American ancestry according to Census 2000. 94.5% spoke English and 4.0% Spanish as their first language.
There were 16,469 households, out of which 26.7% had children under the age of 18 living with them, 58.9% were married couples living together, 8.6% had a female householder with no husband present, and 28.7% were non-families. 23.3% of all households were made up of individuals, and 10.1% had someone living alone who was 65 years of age or older. The average household size was 2.44 and the average family size was 2.85.
In the county, the population was spread out, with 22.8% under the age of 18, 5.5% from 18 to 24, 22.4% from 25 to 44, 31.1% from 45 to 64, and 18.2% who were 65 years of age or older. The median age was 45 years. For every 100 females there were 98.5 males. For every 100 females age 18 and over, there were 95.7 males.
The median income for a household in the county was $41,022, and the median income for a family was $47,379. Males had a median income of $41,827 versus $28,108 for females. The per capita income for the county was $21,420. About 8.7% of families and 11.80% of the population were below the poverty line, including 15.6% of those under age 18 and 6.2% of those age 65 or over.
Economy
The major Calaveras County employers include:
250–499 employees:
- Calaveras County Government
- Forestry & Fire Protection
- Mark Twain St. Joseph's Hospital
100–249 employees:
- Bret Harte Union High School
- Ironstone Vineyards
- Calaveras High School
- Mark Twain Convalescent Hospital
- Mountain Machinery[33]
Government
Calaveras County is governed by a five-member Board of Supervisors. Supervisors are elected by district at the Consolidated Primary Election and serve for four years. Current Board of Supervisors: Gary Tofanelli (District 1); Jack Garamendi (District 2); Martin Huberty (District 3); Amanda Folendorf (District 4) and Benjamin Stopper (District 5). In January 2023 Gary Tofanelli was elected chair of the board and Jack Garamendi was elected Vice Chair. Teresa Hitchcock is the County Executive Officer and Sarah Edwards is the County Counsel. Both are appointed by and serve at the pleasure of the Board of Supervisors.
Elections and politics
Voter registration statistics
| Population and registered voters | ||
|---|---|---|
| Total eligible population[34] | 36,563 | |
| Registered voters[34][note 3] | 32,172 | 87.9% |
| Democratic[34] | 8,529 | 23.3% |
| Republican[34] | 14,857 | 40.6% |
| Democratic–Republican spread[34] | -6,328 | -17.3% |
| American Independent[34] | 1,872 | 5.1% |
| Libertarian[34] | 610 | 1.6% |
| Green[34] | 159 | 0.4% |
| Peace and Freedom[34] | 129 | 0.3% |
| Unknown[34] | 120 | 0.3% |
| Other[34] | 304 | 0.8% |
| No party preference[34] | 5,592 | 15.2% |
Cities by population and voter registration
| Cities by population and voter registration | |||||||
|---|---|---|---|---|---|---|---|
| City | Population[24] | Registered voters[35] [note 3] | Democratic[35] | Republican[35] | D–R spread[35] | Other[35] | No party preference[35] |
| Angels | 3,820 | 61.9% | 31.5% | 42.9% | -11.4% | 11.2% | 18.1% |
Overview
| Election results from statewide races | ||
|---|---|---|
| Year | Office | Results |
| 2010 | Governor | Whitman 53.8 – 39.1% |
| Lieutenant Governor | Maldonado 51.1 – 34.6% | |
| Secretary of State | Dunn 51.0 – 36.7% | |
| Controller | Chiang 49.5 – 38.7% | |
| Treasurer | Walters 46.1 – 43.5% | |
| Attorney General | Cooley 56.7 – 28.5% | |
| Insurance Commissioner | Villines 49.7 – 34.6% | |
Calaveras County is in California's 5th congressional district, represented by Republican Tom McClintock.[36]
In the State Senate, Calaveras County is in the 8th Senate District, represented by Democrat Angelique Ashby.[37] In the State Assembly, it is in the 5th Assembly District, represented by Republican Joe Patterson.[38]
Past presidential elections in Calaveras County have displayed preferences for Republican candidates; the last Democrat to win a majority in the county was Lyndon Johnson in 1964, although Democrat Bill Clinton lost the county by only 17 votes in 1992. By contrast, recent elections have seen a sharp upswing in Democratic voter registrations.[39]
| Year | Republican | Democratic | Third party | |||
|---|---|---|---|---|---|---|
| No. | % | No. | % | No. | % | |
| 2020 | 16,518 | 60.57% | 10,046 | 36.84% | 708 | 2.60% |
| 2016 | 13,511 | 57.42% | 7,944 | 33.76% | 2,076 | 8.82% |
| 2012 | 12,365 | 56.56% | 8,670 | 39.66% | 827 | 3.78% |
| 2008 | 12,835 | 54.80% | 9,813 | 41.90% | 773 | 3.30% |
| 2004 | 13,601 | 60.87% | 8,286 | 37.09% | 456 | 2.04% |
| 2000 | 10,599 | 56.15% | 7,093 | 37.58% | 1,184 | 6.27% |
| 1996 | 8,279 | 48.12% | 6,646 | 38.63% | 2,281 | 13.26% |
| 1992 | 6,006 | 35.35% | 5,989 | 35.25% | 4,996 | 29.40% |
| 1988 | 7,640 | 56.28% | 5,674 | 41.80% | 260 | 1.92% |
| 1984 | 7,632 | 64.26% | 4,081 | 34.36% | 164 | 1.38% |
| 1980 | 6,054 | 58.92% | 3,076 | 29.94% | 1,145 | 11.14% |
| 1976 | 3,695 | 49.08% | 3,607 | 47.91% | 226 | 3.00% |
| 1972 | 4,119 | 60.76% | 2,268 | 33.46% | 392 | 5.78% |
| 1968 | 3,042 | 52.16% | 2,134 | 36.59% | 656 | 11.25% |
| 1964 | 2,244 | 41.58% | 3,145 | 58.27% | 8 | 0.15% |
| 1960 | 2,820 | 52.60% | 2,509 | 46.80% | 32 | 0.60% |
| 1956 | 2,843 | 57.91% | 2,049 | 41.74% | 17 | 0.35% |
| 1952 | 3,112 | 61.65% | 1,890 | 37.44% | 46 | 0.91% |
| 1948 | 1,888 | 46.77% | 1,995 | 49.42% | 154 | 3.81% |
| 1944 | 1,455 | 43.19% | 1,893 | 56.19% | 21 | 0.62% |
| 1940 | 1,649 | 40.39% | 2,405 | 58.90% | 29 | 0.71% |
| 1936 | 960 | 27.16% | 2,520 | 71.31% | 54 | 1.53% |
| 1932 | 754 | 29.01% | 1,744 | 67.10% | 101 | 3.89% |
| 1928 | 1,262 | 53.79% | 1,066 | 45.44% | 18 | 0.77% |
| 1924 | 872 | 39.44% | 333 | 15.06% | 1,006 | 45.50% |
| 1920 | 1,480 | 63.96% | 641 | 27.70% | 193 | 8.34% |
| 1916 | 1,175 | 40.91% | 1,524 | 53.06% | 173 | 6.02% |
| 1912 | 5 | 0.16% | 1,869 | 60.51% | 1,215 | 39.33% |
| 1908 | 1,323 | 55.54% | 833 | 34.97% | 226 | 9.49% |
| 1904 | 1,571 | 58.75% | 844 | 31.56% | 259 | 9.69% |
| 1900 | 1,600 | 54.59% | 1,288 | 43.94% | 43 | 1.47% |
| 1896 | 1,541 | 49.92% | 1,518 | 49.17% | 28 | 0.91% |
| 1892 | 1,355 | 49.69% | 1,276 | 46.79% | 96 | 3.52% |
Crime
The following table includes the number of incidents reported and the rate per 1,000 persons for each type of offense.
| Population and crime rates | ||
|---|---|---|
| Population[24] | 45,794 | |
| Violent crime[40] | 84 | 1.83 |
| Homicide[40] | 1 | 0.02 |
| Forcible rape[40] | 16 | 0.35 |
| Robbery[40] | 14 | 0.31 |
| Aggravated assault[40] | 53 | 1.16 |
| Property crime[40] | 523 | 11.42 |
| Burglary[40] | 284 | 6.20 |
| Larceny-theft[40][note 4] | 405 | 8.84 |
| Motor vehicle theft[40] | 99 | 2.16 |
| Arson[40] | 8 | 0.17 |
Cities by population and crime rates
| Cities by population and crime rates | ||||||||
|---|---|---|---|---|---|---|---|---|
| City | Population[41] | Violent crimes[41] | Violent crime rate per 1,000 persons | Property crimes[41] | Property crime rate per 1,000 persons | |||
| City of Angels | 3,826 | 14 | 3.66 | 86 | 22.48 | |||
Transportation
Major highways


Public transportation
Calaveras Connect provides service in Angels Camp, San Andreas, and other communities in the county. Intercounty connections are available to Columbia (Tuolumne County), Jackson (Amador County)
Airports
Calaveras County Airport is a general aviation airport located just southeast of San Andreas.
Communities
Cities
Angels Camp is the only incorporated city located in Calaveras County.
Census-designated places
Other communities
Former settlements
Special districts
- Altaville Cemetery District
- Altaville-Melones Fire District
- Angels Camp Fire District
- Bret Harte Union High School District
- Calaveras County Air Pollution Control District
- Calaveras Unified School District
- Central Calaveras Fire and Rescue Protection District
- Copperopolis Fire Protection District
- Ebbetts Pass Fire Protection District
- Foothill Fire District
- Jenny Lind Fire District
- Mark Twain Health Care District
- Mark Twain Union Elementary School District
- Mokelumne Hill Fire District
- Murphys Fire District
- San Andreas Fire District
- Vallecito Union Elementary School District
- Valley Springs Public Utilities District
- West Point Fire District.[42]
Population ranking
The population ranking of the following table is based on the 2010 census of Calaveras County.[43]
† county seat
| Rank | City/Town/etc. | Municipal type | Population (2010 Census) |
|---|---|---|---|
| 1 | Rancho Calaveras | CDP | 5,325 |
| 2 | Arnold | CDP | 3,843 |
| 3 | Angels Camp | City | 3,836 |
| 4 | Copperopolis | CDP | 3,671 |
| 5 | Valley Springs | CDP | 3,553 |
| 6 | † San Andreas | CDP | 2,783 |
| 7 | Murphys | CDP | 2,213 |
| 8 | Mountain Ranch | CDP | 1,628 |
| 9 | Forest Meadows | CDP | 1,249 |
| 10 | West Point | CDP | 674 |
| t-11 | Avery | CDP | 646 |
| t-11 | Mokelumne Hill | CDP | 646 |
| 12 | Dorrington | CDP | 609 |
| 13 | Rail Road Flat | CDP | 475 |
| 14 | Vallecito | CDP | 442 |
| 15 | Wallace | CDP | 403 |
See also
- USS Calaveras County (LST-516)
- List of school districts in Calaveras County, California
- Calaveras Big Trees State Park
- Mercer Caverns
- Moaning Cavern
- National Register of Historic Places listings in Calaveras County, California
Notes
- ^ Other = Some other race + Two or more races
- ^ Native American = Native Hawaiian or other Pacific Islander + American Indian or Alaska Native
- ^ a b Percentage of registered voters with respect to total population. Percentages of party members with respect to registered voters follow.
- ^ Only larceny-theft cases involving property over $400 in value are reported as property crimes.
References
- ^ a b "Chronology". California State Association of Counties. Archived from the original on January 29, 2016. Retrieved February 6, 2015.
- ^ a b "Supervisors".
- ^ "Solano County - County Administrator".
- ^ Corral Ridge
- ^ "Calaveras County, California". United States Census Bureau. Retrieved January 30, 2022.
- ^ "Find a County". National Association of Counties. Archived from the original on May 31, 2011. Retrieved June 7, 2011.
- ^ "Underlying Cause of Death, 1999–2015 Results". Centers for Disease Control and Prevention. Retrieved January 11, 2017.
- ^ Lyman, George D. John Marsh, Pioneer: The Life Story of a Trail-blazer on Six Frontiers, pp. 207–8, The Chautauqua Press, Chautauqua, New York, 1931.
- ^ Winkley, John W., Dr. John Marsh: Wilderness Scout, pp. 54–5, The Parthenon Press, Nashville, Tennessee, 1962.
- ^ Thompson, Thomas Hinkley, and West, Albert Augustus. History of San Joaquin County, California, p. 13, 1879.
- ^ Parvini, Sarah (February 28, 2018). "A rural county legalized marijuana farms. It took their tax money – then voted to ban them". Los Angeles Times. Retrieved October 3, 2019.
- ^ Koeppel, Elliot H. (December 1996). "Angels Camp". The California Gold Country: Highway 49 Revisited. Malakoff & Co. ISBN 0-938121-12-X.
- ^ "Calaverite: Calaverite mineral information and data". www.mindat.org. Retrieved March 25, 2018.
- ^ American Journal of Science. (2). xlv, p. 314.
- ^ http://www.libraries.psu.edu/content/dam/psul/up/emsl/documents/circulars/circular27.pdf Archived March 4, 2012, at the Wayback Machine Biographical paper on F. A. Genth
- ^ "2010 Census Gazetteer Files". United States Census Bureau. August 22, 2012. Retrieved September 24, 2015.
- ^ "Annual Estimates of the Resident Population for Counties: April 1, 2020 to July 1, 2023". United States Census Bureau. Retrieved March 26, 2024.
- ^ "Census of Population and Housing from 1790-2000". US Census Bureau. Retrieved January 24, 2022.
- ^ "Historical Census Browser". University of Virginia Library. Retrieved September 24, 2015.
- ^ Forstall, Richard L., ed. (March 27, 1995). "Population of Counties by Decennial Census: 1900 to 1990". United States Census Bureau. Retrieved September 24, 2015.
- ^ "Census 2000 PHC-T-4. Ranking Tables for Counties: 1990 and 2000" (PDF). United States Census Bureau. April 2, 2001. Retrieved September 24, 2015.
- ^ a b "P2 HISPANIC OR LATINO, AND NOT HISPANIC OR LATINO BY RACE - 2010: DEC Redistricting Data (PL 94-171) - Calaveras County, California". United States Census Bureau.
- ^ a b "P2 HISPANIC OR LATINO, AND NOT HISPANIC OR LATINO BY RACE - 2020: DEC Redistricting Data (PL 94-171) - Calaveras County, California". United States Census Bureau.
- ^ a b c d e f g h i j k l m n o p U.S. Census Bureau. American Community Survey, 2011 American Community Survey 5-Year Estimates, Table B02001. U.S. Census website . Retrieved October 26, 2013.
- ^ a b U.S. Census Bureau. American Community Survey, 2011 American Community Survey 5-Year Estimates, Table B03003. U.S. Census website . Retrieved October 26, 2013.
- ^ a b U.S. Census Bureau. American Community Survey, 2011 American Community Survey 5-Year Estimates, Table B19301. U.S. Census website . Retrieved October 21, 2013.
- ^ a b U.S. Census Bureau. American Community Survey, 2011 American Community Survey 5-Year Estimates, Table B19013. U.S. Census website . Retrieved October 21, 2013.
- ^ a b U.S. Census Bureau. American Community Survey, 2011 American Community Survey 5-Year Estimates, Table B19113. U.S. Census website . Retrieved October 21, 2013.
- ^ a b U.S. Census Bureau. American Community Survey, 2011 American Community Survey 5-Year Estimates. U.S. Census website . Retrieved October 21, 2013.
- ^ U.S. Census Bureau. American Community Survey, 2011 American Community Survey 5-Year Estimates, Table B01003. U.S. Census website . Retrieved October 21, 2013.
- ^ "2010 Census P.L. 94-171 Summary File Data". United States Census Bureau.
- ^ "U.S. Census website". United States Census Bureau. Retrieved May 14, 2011.
- ^ "Calaveras County Largest Employers". usaINFO. January 2008. Archived from the original on May 13, 2006. Retrieved March 10, 2008.
- ^ a b c d e f g h i j k l "Statement of Vote, November 8, 2022, General Election" (PDF). California Secretary of State. California Secretary of State. Retrieved May 5, 2023.
- ^ a b c d e f California Secretary of State. February 10, 2013 – Report of Registration Archived November 3, 2013, at the Wayback Machine. Retrieved October 31, 2013.
- ^ "California's 5th Congressional District - Representatives & District Map". Civic Impulse, LLC. Retrieved March 1, 2023.
- ^ "Senators". State of California. Retrieved March 20, 2013.
- ^ "Members Assembly". State of California. Retrieved March 20, 2013.
- ^ "Election Archives". elections.co.calaveras.ca.us. Retrieved October 21, 2017.
- ^ a b c d e f g h i j Office of the Attorney General, Department of Justice, State of California. Table 11: Crimes – 2009 Archived December 2, 2013, at the Wayback Machine. Retrieved November 14, 2013.
- ^ a b c United States Department of Justice, Federal Bureau of Investigation. Crime in the United States, 2012, Table 8 (California). Retrieved November 14, 2013.
- ^ "Largest Calaveras County Employers". infoUSA. January 2008. Archived from the original on May 13, 2006. Retrieved March 10, 2008.
- ^ 2010 Census
Further reading
- A Memorial and Biographical History of the Counties of Merced, Stanislaus, Calaveras, Tuolumne and Mariposa, California. Chicago: Lewis Publishing Co., 1892.
- "Tuolumne-Calaveras Unit: 2005 Pre-Fire Management Plan September 28, 2005 Edition," California Department of Forestry and Fire Protection, Sep 28, 2005, pp. 16, 17
- United States Department of Education, National Center for Education Statistics.
External links
Wikimedia Commons has media related to
Calaveras County, California.
Calaveras County, California.
- Official website

- Calaveras County Visitors Bureau
- Angels Camp, Calaveras County, weather
- Arnold, Calaveras County, weather
- Calaveras County Superior Court
- Map of fire stations in Calaveras County
Places adjacent to Calaveras County, California | ||||||||||||||||
|---|---|---|---|---|---|---|---|---|---|---|---|---|---|---|---|---|
| ||||||||||||||||


- v
- t
- e
Municipalities and communities of Calaveras County, California, United States
County seat: San Andreas
communities
settlements
- California portal
- United States portal

Authority control databases | |
|---|---|
| International |
|
| National |
|
| Geographic |
|
| Other |
|
38°13′N 120°33′W / 38.21°N 120.55°W / 38.21; -120.55


