1904 United States presidential election in Maryland
 | ||||||||||||||||||||||||||
| ||||||||||||||||||||||||||
 County Results
| ||||||||||||||||||||||||||
| ||||||||||||||||||||||||||
The 1904 United States presidential election in Maryland took place on November 8, 1904. All contemporary 45 states were part of the 1904 United States presidential election. State voters chose eight electors to the Electoral College, which selected the president and vice president.
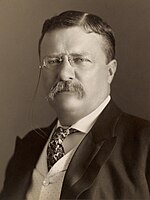
The winner in Maryland depended on the votes, supposedly due to the “Wilson Law” designed to make it easier for Democrats to cast ballots for both Presidential electors and Congress by a simple turning down of a single fold in the ballot paper.[2] Seven electoral votes were won by the Democratic nominees, Chief Judge Alton B. Parker of New York and his running mate Henry G. Davis of West Virginia, while the Republican nominees, President Theodore Roosevelt of New York and his running mate Charles W. Fairbanks of Indiana, won the popular vote and one electoral vote. Roosevelt’s popular vote margin is the second-closest presidential election margin by number of votes on record, behind Henry Clay's four-vote 1832 win,[3] also in Maryland. In this election, Maryland voted 18.81% more Democratic than the nation at-large.[4]
Results
| 1904 United States presidential election in Maryland[5] | |||||
|---|---|---|---|---|---|
| Party | Candidate | Votes | Percentage | Electoral votes | |
| Democratic | Alton B. Parker | 109,446 | 48.81% | 7[a] | |
| Republican | Theodore Roosevelt (incumbent) | 109,497 | 48.83% | 1[a] | |
| Prohibition | Silas C. Swallow | 3,034 | 1.35% | 0 | |
| Social Democratic | Eugene V. Debs | 2,247 | 1.00% | 0 | |
| Write-ins | Scattered | 4 | 0.00% | 0 | |
| Populist | Thomas E. Watson | 1 | 0.00% | 0 | |
| Totals | 224,229 | 100.00% | 8 | ||
| Voter turnout | — | ||||
Results by county
| County | Theodore Roosevelt[6] Republican | Alton Brooks Parker[6] Democratic | Silas Comfort Swallow[7] Prohibition | Eugene Victor Debs[7] Social Democratic | Margin | Total votes cast | |||||
|---|---|---|---|---|---|---|---|---|---|---|---|
| # | % | # | % | # | % | # | % | # | % | ||
| Allegany | 5,232 | 56.32% | 3,326 | 35.81% | 318 | 3.42% | 413 | 4.45% | 1,906 | 20.52% | 9,289 |
| Anne Arundel | 2,849 | 47.64% | 3,001 | 50.18% | 108 | 1.81% | 22 | 0.37% | -152 | -2.54% | 5,980 |
| Baltimore | 7,570 | 43.89% | 9,394 | 54.47% | 194 | 1.12% | 88 | 0.51% | -1,824 | -10.58% | 17,246 |
| Baltimore City | 47,444 | 48.64% | 47,901 | 49.11% | 731 | 0.75% | 1,461 | 1.50% | -457 | -0.47% | 97,537 |
| Calvert | 1,030 | 57.48% | 740 | 41.29% | 17 | 0.95% | 5 | 0.28% | 290 | 16.18% | 1,792 |
| Caroline | 1,452 | 43.09% | 1,809 | 53.68% | 86 | 2.55% | 23 | 0.68% | -357 | -10.59% | 3,370 |
| Carroll | 3,357 | 47.77% | 3,527 | 50.19% | 130 | 1.85% | 13 | 0.19% | -170 | -2.42% | 7,027 |
| Cecil | 2,425 | 48.14% | 2,554 | 50.70% | 53 | 1.05% | 5 | 0.10% | -129 | -2.56% | 5,037 |
| Charles | 1,659 | 57.80% | 1,180 | 41.11% | 24 | 0.84% | 7 | 0.24% | 479 | 16.69% | 2,870 |
| Dorchester | 2,680 | 55.04% | 2,087 | 42.86% | 86 | 1.77% | 16 | 0.33% | 593 | 12.18% | 4,869 |
| Frederick | 5,788 | 52.83% | 5,004 | 45.67% | 149 | 1.36% | 15 | 0.14% | 784 | 7.16% | 10,956 |
| Garrett | 2,051 | 66.96% | 947 | 30.92% | 47 | 1.53% | 18 | 0.59% | 1,104 | 36.04% | 3,063 |
| Harford | 2,561 | 43.91% | 3,151 | 54.02% | 117 | 2.01% | 4 | 0.07% | -590 | -10.11% | 5,833 |
| Howard | 1,258 | 39.00% | 1,914 | 59.33% | 40 | 1.24% | 14 | 0.43% | -656 | -20.33% | 3,226 |
| Kent | 1,841 | 47.91% | 1,956 | 50.90% | 44 | 1.14% | 2 | 0.05% | -115 | -2.99% | 3,843 |
| Montgomery | 2,711 | 46.09% | 3,082 | 52.40% | 79 | 1.34% | 10 | 0.17% | -371 | -6.31% | 5,882 |
| Prince George's | 2,845 | 55.36% | 2,270 | 44.17% | 18 | 0.35% | 6 | 0.12% | 575 | 11.19% | 5,139 |
| Queen Anne's | 1,487 | 38.28% | 2,258 | 58.12% | 130 | 3.35% | 10 | 0.26% | -771 | -19.85% | 3,885 |
| Somerset | 1,874 | 51.53% | 1,580 | 43.44% | 177 | 4.87% | 6 | 0.16% | 294 | 8.08% | 3,637 |
| St. Mary's | 1,174 | 48.00% | 1,247 | 50.98% | 21 | 0.86% | 4 | 0.16% | -73 | -2.98% | 2,446 |
| Talbot | 1,999 | 50.53% | 1,861 | 47.04% | 89 | 2.25% | 7 | 0.18% | 138 | -3.49% | 3,956 |
| Washington | 4,581 | 51.86% | 4,064 | 46.01% | 103 | 1.17% | 85 | 0.96% | 517 | 5.85% | 8,833 |
| Wicomico | 2,179 | 44.47% | 2,593 | 52.92% | 127 | 2.59% | 1 | 0.02% | -414 | -8.45% | 4,900 |
| Worcester | 1,450 | 40.19% | 2,000 | 55.43% | 146 | 4.05% | 12 | 0.33% | -550 | -15.24% | 3,608 |
| Totals | 109,497 | 48.83% | 109,446 | 48.81% | 3,034 | 1.35% | 2,247 | 1.00% | 51 | 0.02% | 224,229[b] |
Counties that flipped from Republican to Democratic
See also
- United States presidential elections in Maryland
- 1904 United States presidential election
- 1904 United States elections
Notes
- ^ a b c d Seven of the eight highest electors were for Parker, but the highest Roosevelt elector, Charles J. Bonaparte, had 51 more votes than the highest Parker elector, Frank Brown.[1]
- ^ This total include five write-in votes not grouped by county, one of which was for Populist nominee Thomas E. Watson, who was on the ballot in 34 of the contemporary 45 states.
References
- ^ Dave Leip’s U.S. Election Atlas; 1904 Presidential Electors – Maryland
- ^ ‘Taft Gets Part of Maryland Vote – Trick Ballot Prevented Republicans from Getting a Big Plurality’; Special to the New York Times, November 6, 1908, p. 2
- ^ Dave Leip's U.S. Election Atlas; 1832 Presidential General Election Results – Maryland
- ^ "Dave Leip's Atlas of U.S. Presidential Elections". uselectionatlas.org. Retrieved March 12, 2023.
- ^ Dave Leip's U.S. Election Atlas; 1904 Presidential General Election Results – Maryland
- ^ a b Géoelections; Popular Vote at the Presidential Election for 1904 (.xlsx file for €15)
- ^ a b Géoelections; Popular Vote for Eugene Debs at the Presidential Election for 1904 (.xlsx file for €15)


