1964 United States presidential election in Maryland
|
|
| |  |  | | Nominee | Lyndon B. Johnson | Barry Goldwater | | | Party | Democratic | Republican | | Home state | Texas | Arizona | | Running mate | Hubert Humphrey | William E. Miller | | Electoral vote | 10 | 0 | | Popular vote | 730,912 | 385,495 | | Percentage | 65.47% | 34.53% | |
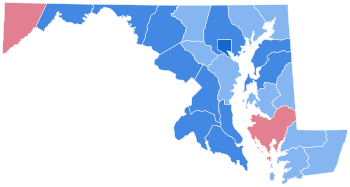 County Results | Johnson 50-60% 60-70% 70-80% | Goldwater 50-60% | |
President before election
Lyndon B. Johnson
Democratic | Elected President
Lyndon B. Johnson
Democratic | |
| Elections in Maryland |
|---|
 |
| |
| |
| County executive elections |
|---|
| | | County offices |
|---|
| |
|
| |
| |
| |
 Government Government |
|
The 1964 United States presidential election in Maryland took place on November 3, 1964, as part of the 1964 United States presidential election. State voters chose 10[1] representatives, or electors, to the Electoral College, who voted for president and vice president.
Primary
Democratic primary
1964 Maryland Democratic presidential primary
|
|
| |
 County Results | Brewster 40-50% 50-60% 60-70% 70-80% | Wallace 40-50% 50-60% 60-70% 70-80% 80-90% | |
1964 Maryland Democratic presidential primary[2] | Candidate | Votes | % |
| Daniel Brewster | 267,106 | 53.14 |
| George Wallace (write-in) | 214,849 | 42.75 |
| Unpledged | 12,377 | 2.46 |
| Andrew J. Easter | 8,275 | 1.65 |
| Total | 502,607 | 100.0 |
Campaign
George Wallace ran in the Democratic primary, but was defeated by U.S. Senator Daniel Brewster, who served as a surrogate for Johnson. Wallace won a majority of the white vote.
As of the 2020 presidential election, this is the last election in which Harford County, Carroll County, Washington County, Wicomico County, Worcester County, Queen Anne's County and Caroline County voted for a Democratic Presidential candidate.[4]
Anne Arundel County would not vote Democratic again until 2016, while Frederick and Talbot counties would not do so until 2020, with Donald Trump being the first Republican to lose all three of these counties, as well as the statewide white vote, since this election.[4] However, Dorchester County on the Eastern Shore flipped against the trend from Kennedy to Goldwater, reflecting the racial tension in the area at this time and the declaration of martial law in the county by Governor J. Millard Tawes in response; similarly, it would be the only county in the state where George Wallace (who had given a speech there during the 1964 primary campaign) finished in second place four years later, ahead of Democratic Vice President Hubert Humphrey.[5]
Results
Results by county
| County | Lyndon B. Johnson
Democratic | Barry Goldwater
Republican | Margin | Total votes cast[7] |
| # | % | # | % | # | % |
| Allegany | 20,425 | 62.25% | 12,384 | 37.75% | 8,041 | 24.50% | 32,809 |
| Anne Arundel | 37,981 | 58.70% | 26,725 | 41.30% | 11,256 | 17.40% | 64,706 |
| Baltimore | 117,153 | 60.07% | 77,870 | 39.93% | 39,283 | 20.14% | 195,073 |
| Baltimore City | 240,716 | 75.98% | 76,089 | 24.02% | 164,627 | 51.96% | 316,805 |
| Calvert | 3,335 | 65.39% | 1,765 | 34.61% | 1,570 | 30.78% | 5,100 |
| Caroline | 3,710 | 57.91% | 2,696 | 42.09% | 1,014 | 15.82% | 6,406 |
| Carroll | 8,451 | 50.35% | 8,332 | 49.65% | 119 | 0.70% | 16,783 |
| Cecil | 7,854 | 59.57% | 5,330 | 40.43% | 2,524 | 19.14% | 13,184 |
| Charles | 6,546 | 65.45% | 3,455 | 34.55% | 3,091 | 30.90% | 10,001 |
| Dorchester | 4,564 | 46.14% | 5,327 | 53.86% | -763 | -7.72% | 9,891 |
| Frederick | 14,548 | 61.10% | 9,264 | 38.90% | 5,284 | 22.20% | 23,812 |
| Garrett | 3,515 | 49.24% | 3,624 | 50.76% | -109 | -1.52% | 7,139 |
| Harford | 13,550 | 57.62% | 9,968 | 42.38% | 3,582 | 15.24% | 23,518 |
| Howard | 8,185 | 54.50% | 6,833 | 45.50% | 1,352 | 9.00% | 15,018 |
| Kent | 4,113 | 67.19% | 2,008 | 32.81% | 2,105 | 34.38% | 6,121 |
| Montgomery | 103,113 | 66.24% | 52,554 | 33.76% | 50,559 | 32.48% | 155,667 |
| Prince George's | 81,806 | 63.80% | 46,413 | 36.20% | 35,393 | 27.60% | 128,219 |
| Queen Anne's | 4,052 | 67.45% | 1,955 | 32.55% | 2,097 | 34.90% | 6,007 |
| Somerset | 4,527 | 58.93% | 3,155 | 41.07% | 1,372 | 17.86% | 7,682 |
| St. Mary's | 5,831 | 66.95% | 2,878 | 33.05% | 2,953 | 33.90% | 8,709 |
| Talbot | 4,671 | 55.85% | 3,693 | 44.15% | 978 | 11.70% | 8,364 |
| Washington | 19,858 | 60.89% | 12,756 | 39.11% | 7,102 | 21.78% | 32,614 |
| Wicomico | 8,695 | 53.86% | 7,448 | 46.14% | 1,247 | 7.72% | 16,143 |
| Worcester | 3,713 | 55.53% | 2,973 | 44.47% | 740 | 11.06% | 6,686 |
| Totals | 730,912 | 65.47% | 385,495 | 34.53% | 345,417 | 30.94% | 1,116,457 |
Counties that flipped from Democratic to Republican
Counties that flipped from Republican to Democratic
[8][9]
References
- ^ "1964 Election for the Forty-Fifth Term (1965-69)". Retrieved May 30, 2017.
- ^ "OurCampaigns". Retrieved June 26, 2024.
- ^ a b Sullivan, Robert David; ‘How the Red and Blue Map Evolved Over the Past Century’; America Magazine in The National Catholic Review; June 29, 2016
- ^ School Desegregation in Dorchester County, Maryland (PDF). United States Commission on Civil Rights. September 1977.
- ^ Maryland Manual 1965–1966. The Hall of Records Commission of the State of Maryland. p. 477. Retrieved May 12, 2019.
- ^ Scammon, Richard M. (compiler); America at the Polls: A Handbook of Presidential Election Statistics 1920-1964; p. 211 ISBN 0405077114
- ^ "1960 Presidential General Election Results - Maryland". Dave Leip's election atlas. Retrieved January 10, 2024.
- ^ "1964 Presidential General Election Results - Maryland". Dave Leip's election atlas. Retrieved January 10, 2024.
Works cited
|
|---|
| President | |
|---|
U.S.
Senate | |
|---|
U.S.
House | |
|---|
State
governors | |
|---|
State
legislature | |
|---|
|
|---|
| Democratic Party | |
|---|
| Republican Party | |
|---|
|
|