U.S. presidential election in Maryland
2012 United States presidential election in Maryland Turnout 74.00% [1] Nominee Barack Obama Mitt Romney Party Democratic Republican Home state Illinois Massachusetts Running mate Joe Biden Paul Ryan Electoral vote 10 0 Popular vote 1,677,844 971,869 Percentage 61.97% 35.90%
County Results
Obama
50-60%
60-70%
70-80%
80-90%
Romney
40-50%
50-60%
60-70%
70-80%
President before election Barack Obama
Elected President Barack Obama
Elections in Maryland County executive elections County offices
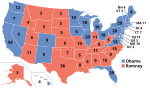
The 2012 United States presidential election in Maryland took place on November 6, 2012, as part of the 2012 United States presidential election in which all 50 states plus the District of Columbia participated. Maryland voters chose 10 electors to represent them in the Electoral College via a popular vote pitting incumbent Democratic President Barack Obama and his running mate, Vice President Joe Biden , against Republican challenger and former Massachusetts Governor Mitt Romney and his running mate, Congressman Paul Ryan .
Maryland is one of six states where Obama did better in 2012 than in 2008, with his percentage of the vote increasing from 61.92% to 61.97%. He managed to flip Somerset County but lost Kent County which he won in 2008 . In this election, Maryland voted 22.21% to the left of the nation at-large.[2]
As of the 2020 presidential election , this is the last time a Republican won Anne Arundel County and a Democrat won Somerset County .
Primary elections Democratic primary Republican primary 2012 Maryland Republican presidential primary ← 2008 April 3, 2012 (2012-04-03 ) 2016 →
Maryland results by county
Mitt Romney
Rick Santorum
The Republican primary took place on April 3, 2012, the same day as the District of Columbia Republican primary and the Wisconsin Republican primary .[3]
2012 U.S. presidential election Democratic Party Republican Party Related races
Green primary Green National Convention, Maryland Delegate Vote[6] [7] Candidate Delegates Percentage Jill Stein 5 83% Roseanne Barr 1 17% Others - - Total 6 100%
Libertarian primary Libertarian National Convention, Maryland Delegate Vote [8] Candidate Delegates Percentage Gary Johnson 9 64% R. Lee Wrights 4 29% Carl Person 1 7% Others - - Total 14 100%
General Election Results Results by county County Barack Obama Mitt Romney Various candidates Margin Total votes cast # % # % # % # % Allegany 9,805 32.85% 19,230 64.42% 815 2.73% -9,425 -31.57% 29,850 Anne Arundel 126,635 48.68% 126,832 48.75% 6,688 2.57% -197 -0.07% 260,155 Baltimore 220,322 57.26% 154,908 40.26% 9,552 2.48% 65,414 17.00% 384,782 Baltimore City 221,478 87.19% 28,171 11.09% 4,356 1.71% 193,307 76.10% 254,005 Calvert 20,529 45.10% 23,952 52.62% 1,037 2.28% -3,423 -7.52% 45,518 Caroline 4,970 37.21% 8,098 60.63% 289 2.16% -3,128 -23.42% 13,357 Carroll 27,939 31.92% 56,761 64.84% 2,836 3.24% -28,822 -32.92% 87,536 Cecil 16,557 38.98% 24,806 58.39% 1,117 2.63% -8,249 -19.41% 42,480 Charles 48,774 64.84% 25,178 33.47% 1,270 1.69% 23,596 31.37% 75,222 Dorchester 7,257 46.99% 7,976 51.64% 211 1.37% -719 -4.65% 15,444 Frederick 55,146 47.09% 58,798 50.21% 3,171 2.71% -3,652 -3.12% 117,115 Garrett 3,124 23.74% 9,743 74.05% 290 2.20% -6,619 -50.31% 13,157 Harford 49,729 39.48% 72,911 57.89% 3,314 2.63% -23,182 -18.41% 125,954 Howard 91,393 59.69% 57,758 37.72% 3,957 2.58% 33,635 21.97% 153,108 Kent 4,842 48.89% 4,870 49.17% 192 1.94% -28 -0.28% 9,904 Montgomery 323,400 70.92% 123,353 27.05% 9,239 2.03% 200,047 43.87% 455,992 Prince George's 347,938 89.73% 35,734 9.22% 4,072 1.05% 312,204 80.51% 387,744 Queen Anne's 8,556 34.38% 15,823 63.58% 509 2.05% -7,267 -29.20% 24,888 St. Mary's 19,711 41.22% 26,797 56.03% 1,316 2.75% -7,086 -14.81% 47,824 Somerset 5,240 50.39% 5,042 48.49% 117 1.13% 198 1.90% 10,399 Talbot 8,808 43.05% 11,339 55.42% 312 1.53% -2,531 -12.37% 20,459 Washington 25,042 39.90% 36,074 57.48% 1,639 2.61% -11,032 -17.58% 62,755 Wicomico 19,635 46.46% 21,764 51.50% 860 2.04% -2,129 -5.04% 42,259 Worcester 11,014 40.17% 15,951 58.17% 455 1.66% -4,937 -18.00% 27,420 Totals 1,677,844 61.97% 971,869 35.90% 57,614 2.13% 705,975 26.07% 2,707,327
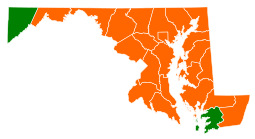
County Flips: Democratic Hold
Gain from Republican
Republican Hold
Gain from Democratic
Counties that flipped from Democratic to Republican Counties that flipped from Republican to Democratic By congressional district Obama won 7 of the state's 8 congressional districts.[10]
See also References ^ "2012 Presidential General Election - Statewide Voter Turnout by County and Party". elections.maryland.gov . ^ "Dave Leip's Atlas of U.S. Presidential Elections". uselectionatlas.org . Retrieved March 31, 2023 . ^ "Maryland Republican Primary". The New York Times . Retrieved June 8, 2015 . ^ "2012 Primary Election Results" (PDF) . Mississippi Republican Party. March 29, 2012. ^ "maryland Republican Primary - Election Results - Election 2012". The New York Times . ^ "2012 primaries - Jill Stein for President". www.jillstein.org . Archived from the original on February 15, 2015. Retrieved January 11, 2022 . ^ Archived at Ghostarchive and the Wayback Machine: "Green Party Presidential Convention State by State Delegation Vote". YouTube ^ "2012 Libertarian National Convention" (PDF) . Libertarian Party. May 3–6, 2012. ^ "Maryland State Board of Elections". Retrieved November 10, 2012 . ^ "Maryland 2012 pres-by-cd".
U.S. U.S. U.S.(Election Governors Attorneys State Arizona California Connecticut Delaware Florida Hawaii Illinois Iowa Michigan Minnesota Montana New Mexico New York North Carolina Oregon Pennsylvania Texas Washington Wisconsin Mayoral Alexandria, VA Anchorage, AK Augusta, GA Austin, TX Bakersfield, CA Baton Rouge, LA Cheyenne, WY Corpus Christi, TX Fort Lauderdale, FL Fresno, CA Gilbert, AZ Glendale, AZ Honolulu, HI Huntsville, AL Irvine, CA Juneau, AK Lubbock, TX Mesa, AZ Miami-Dade County, FL Milwaukee, WI Orlando, FL Portland, OR Richmond, VA Riverside, CA Sacramento, CA San Diego, CA San Juan, PR Santa Ana, CA Scottsdale, AZ Stockton, CA Virginia Beach, VA Wilmington, DE States and
Democratic Party
Republican Party
Libertarian Party
Green Party

 [1]
[1]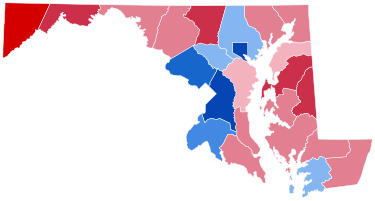


 Mitt Romney
 Government